 |
|
 |
|
 |
|
 |
|
 |
|
 |
|
 |
|
 |
|
 |
|
 |
|
 |
|
 |
|
 |
|
 |
|
 |
|
Panews在5月4日報導說,Fidelity Investments全球宏觀總監Jurrien Timmer最近發表了一篇文章,詳細分析了比特幣與黃金之間的動態關係。

In a recent article, Jurrien Timmer, global macro director at Fidelity Investments, discussed in detail the dynamic relationship between Bitcoin and gold, highlighting the changing trends of their Sharpe ratios and relative performance, which he believes may be at a turning point. Citing data from Fidelity Management and Research Company (FMR Co) and Bloomberg, Timmer's analysis began with an observation on the ironic negative correlation between gold and Bitcoin.
Fidelity Investments的全球宏觀總監Jurrien Timmer在最近的一篇文章中詳細討論了比特幣與黃金之間的動態關係,強調了其Sharpe比率和相對績效的變化趨勢,他認為這可能處於轉折點。蒂默的分析引用了富達管理和研究公司(FMR CO)和彭博社的數據,始於對黃金和比特幣之間具有諷刺意味的負相關性的觀察。
As the chart below shows, the Sharpe ratios of the two assets have been alternating recently. It seems like Bitcoin’s ‘lead moment’ may be next, as its Sharpe ratio is currently -0.40, while gold’s is 1.33. So, we may be witnessing a baton handover from gold to Bitcoin.
如下圖所示,這兩個資產的夏普比率最近在交替。似乎比特幣的“領先時刻”可能是下一個,因為其夏普比率目前為-0.40,而黃金的比率為1.33。因此,我們可能目睹了從黃金到比特幣的接力棒移交。
Sharpe Ratio (Last 10 Years)As of March 31, 2023Source: FMR Co, via Bloomberg
夏普(Sharpe)比率(最近10年)截至2023年3月31日:FMR CO,通過彭博社
Sharpe Ratio (Last 10 Years)
夏普比率(最近10年)
The higher the Sharpe ratio, the better the risk-adjusted return. A negative Sharpe ratio indicates that the return is less than risk-free rates, while a positive Sharpe ratio indicates that the investment is generating returns above the risk-free rate of interest.
夏普比率越高,風險調整後的回報越好。負夏普比率表明收益小於無風險利率,而正夏普比率表明投資的回報率高於無風險利率。
The lower volatility of gold compared to Bitcoin is evident, with gold’s standard deviation of annual total returns being around 20%, compared to around 80% for Bitcoin. Hence, when considering the ratio of average annual total return to the standard deviation of annual total return, a four-to-one ratio in terms of portfolio allocation seems appropriate.
與比特幣相比,黃金的波動率較低,明顯的是,黃金的年總收益的標準偏差約為20%,而比特幣的標準偏差約為80%。因此,當考慮平均年度總回報與年度總收益的標準偏差的比率時,就投資組合分配而言,四對一的比率似乎是合適的。
This difference in volatility also becomes apparent when examining their annual total returns over the past 10 years. In 2013, the worst year for gold in the past 10 years, it still managed a return of -10%, while the worst year for Bitcoin was 2014, with a loss of around -46%.
在檢查過去10年的年度總回報時,波動率的這種差異也顯而易見。在2013年,這是過去10年中黃金最糟糕的一年,它的回報率仍然為-10%,而比特幣最糟糕的一年是2014年,損失約為-46%。
However, in 2019, Bitcoin had an annual total return of around 90%, compared to around 15% for gold.
但是,在2019年,比特幣的年總收益約為90%,而黃金的總回報率約為15%。
The implication is that for a portfolio of four parts gold to one part Bitcoin, the average annual total return would be around 10%, with a standard deviation of around 20%.
這意味著,對於一部分黃金到一個比特幣的投資組合,年平均總收益率為10%,標準偏差約為20%。
At the beginning of 2013, a hypothetical portfolio of four parts gold to one part Bitcoin would have been worth $500,000. Over the past 10 years, with annual contributions of $50,000 at the beginning of each year, the portfolio would have grown to around $3.6 million by the end of March 2023, an average annual total return of 9.8% and a standard deviation of annual total return of 19.4%.
在2013年初,假想的四分之一黃金到一個比特幣的投資組合價值為500,000美元。在過去的10年中,每年年初的年度捐款為50,000美元,到2023年3月底,投資組合將增長到360萬美元,平均年總收益率為9.8%,年總收益的標準偏差為19.4%。
免責聲明:info@kdj.com
所提供的資訊並非交易建議。 kDJ.com對任何基於本文提供的資訊進行的投資不承擔任何責任。加密貨幣波動性較大,建議您充分研究後謹慎投資!
如果您認為本網站使用的內容侵犯了您的版權,請立即聯絡我們(info@kdj.com),我們將及時刪除。
-

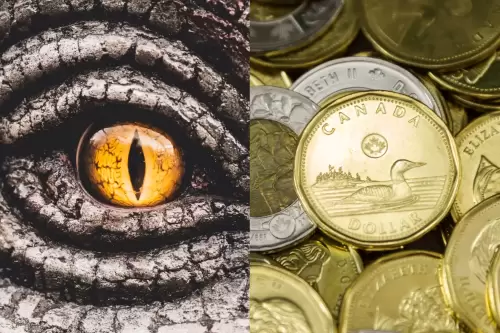
- 侏羅紀世界遇到加拿大硬幣:意外的靈感
- 2025-08-06 00:03:30
- 探索侏羅紀世界氛圍和加拿大造幣與新的恐龍眼硬幣的迷人交集,這是史前靈感的證明。
-

- 分散的掠奪者是中心舞台:主網發布和網絡增長
- 2025-08-06 00:03:27
- 探索區塊鏈空間中分散的掠奪,主網發布和網絡擴展的興起,重點是簡潔和IKA。
-

-

- Elevenlabs,AI音樂和藝術家許可:導航新的Soundscape
- 2025-08-05 23:46:16
- 探索具有Elevenlabs的AI音樂不斷發展的景觀,藝術家許可的挑戰以及創意合作的未來。
-

-

- 顯微鏡下的UNISWAP估值:位CIO的觀點
- 2025-08-05 22:04:09
- 通過位於CIO Matt Hougan的鏡頭,監管發展和技術指標分析Uniswap的估值。
-

-

-


