 |
|
 |
|
 |
|
 |
|
 |
|
 |
|
 |
|
 |
|
 |
|
 |
|
 |
|
 |
|
 |
|
 |
|
 |
|
FET价格在过去的几个月中陷入了稳定的下降趋势。自2024年12月下旬以来,价格已经形成了一致的较低高点和较低的低点。

The price of FET, traded on Binance, has spent the past few months forming lower highs and lower lows, indicating a downtrend. Since December 2024, the token has been struggling to break free from a descending trendline that provides immediate resistance.
FET的价格(以Binance进行了交易)在过去的几个月中,形成了较低的高点和较低的低点,表明下降趋势。自2024年12月以来,令牌一直在努力摆脱立即抵抗的下降趋势线。
However, in mid-April, FET broke out of this trendline with a strong bullish candle, shifting the market structure. After the breakout, the token began forming higher highs and higher lows for the first time in months.
然而,在4月中旬,FET用强有力的看涨蜡烛脱离了这种趋势线,从而改变了市场结构。突破之后,令牌开始在几个月内首次形成更高的高点和更高的低点。
As of press time, FET is trading at around $0.73, bouncing from earlier 2025 lows and approaching key resistance levels that could decide the next major move.
截至发稿时,FET的交易价格约为0.73美元,从2025年前的低点弹起,接近关键阻力水平,可以决定下一步的重大行动。
Artificial Superintelligence Alliance (FET) Chart: Key Levels to Watch
人工超级智能联盟(FET)图表:要观看的关键水平
As the breakout zone was hit with strong momentum, the price quickly moved toward the $0.74 resistance area. A confirmed close above $0.74-$0.75 is needed to open the door to higher targets near $0.90 and $1.00.
随着突破区的势头强劲,价格迅速转向了0.74美元的电阻区域。确认的关闭超过$ 0.74- $ 0.75需要为$ 0.90和$ 1.00打开大门。
The $0.68-$0.70 range has emerged as short-term support following the breakout. This area was previously a resistance zone but flipped into support after the breakout in April.
突破后,$ 0.68- $ 0.70的范围已成为短期支持。该区域以前是一个阻力区,但四月份突破后被转向支持。
Moreover, the $0.55-$0.58 zone provides stronger support, aligning with the earlier breakout retest level.
此外,$ 0.55- $ 0.58的区域提供了更强大的支持,与较早的分组重新测试水平保持一致。
Major support is also seen between $0.33 and $0.37, where FET previously formed a solid bottom before launching the current rally. Maintaining these support zones is crucial for preserving the bullish setup.
还可以看到主要的支持在0.33美元至0.37美元之间,在发起当前的集会之前,FET先前又形成了坚实的底部。维持这些支撑区对于保存看涨的设置至关重要。
Key Resistance Levels:
关键阻力水平:
Immediately, resistance is seen at the 38.2 percent Fibonacci retracement level of the 2023 low to 2024 high at around $0.78.
立即,2023低至2024高的斐波那契反回底水平为38.2%,在0.78美元左右。
Next, traders are eyeing the 50 percent Fibonacci retracement level at $0.88.
接下来,贸易商将斐波那契反回收水平的50%关注为0.88美元。
The 200-day SMA, currently at around $1.06, provides strong long-term resistance.
200天的SMA目前为1.06美元,提供了强大的长期抵抗。
Key Support Levels:
关键支持级别:
Short-term support is at the 0.236 percent Fibonacci retracement level at around $0.68.
短期支持为0.236%的斐波那契回撤水平,约为0.68美元。
The 100-percent Fibonacci extension from the breakout point to the breakout retest is seen at $0.55, providing support during the retest.
从突破点到分组重新测试的100%的斐波那契扩展名为0.55美元,在重新测试期间提供了支持。
Stronger support is at the 38.2 percent Fibonacci retracement level, which coincides with the 2024 low, around the $0.33-$0.37 zone.
更强的支持在38.2%的斐波那契回替楼水平,与2024低点相吻合,约为0.33- $ 0.37。
Positive Market Structure Shift But Some Caution Remains
积极的市场结构转移,但仍有一些谨慎
The structure has shifted positively with the breakout and the formation of higher highs and higher lows. However, traders remain cautious about the possibility of a minor pullback.
该结构随着较高的高高和较高低点的突破和形成而积极移动。但是,交易者对较小的回调的可能性保持谨慎。
A minor cooling-off phase toward $0.68-$0.70 is considered healthy for sustaining bullish momentum.
售价为0.68- $ 0.70的小冷却阶段被认为是健康的看涨势头。
If the buyers can maintain the price above the breakout zone and the 0.236 percent Fibonacci retracement level, it suggests that the sellers are losing strength.
如果买家可以将价格维持在分支区域和0.236%的斐波那契回撤水平上,则表明卖方正在失去实力。
If the sellers manage to break the price back below the breakout zone and the 100 percent Fibonacci extension, it may indicate that the buyers are becoming exhausted.
如果卖方设法将价格重新降低到突破区域和100%的斐波那契扩展下,则可能表明买家正在耗尽。
If the price breaks above the 200-day SMA and sustains above it, it would be a strong indication of a macro bullish trend.
如果价格超过200天的SMA并超过其高于其,那将是宏观看涨趋势的有力迹象。
免责声明:info@kdj.com
所提供的信息并非交易建议。根据本文提供的信息进行的任何投资,kdj.com不承担任何责任。加密货币具有高波动性,强烈建议您深入研究后,谨慎投资!
如您认为本网站上使用的内容侵犯了您的版权,请立即联系我们(info@kdj.com),我们将及时删除。
-

-

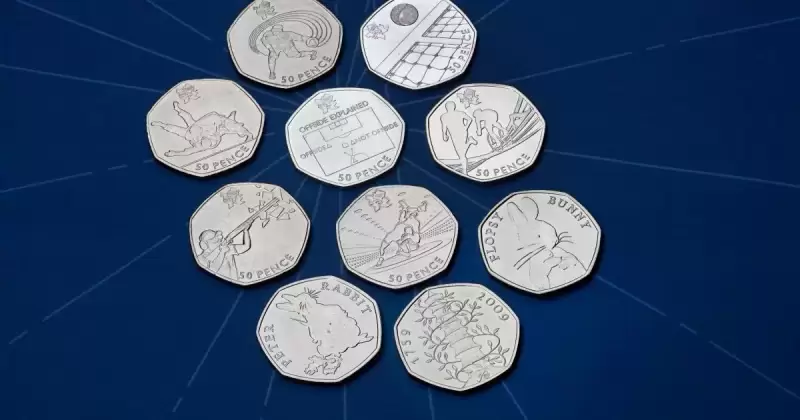
- 罕见的2012年伦敦奥运会水上运动50p硬币的价值超过3,700英镑
- 2025-04-29 05:00:13
- 皇家造币厂于2010年创建了一系列50便士硬币,以庆祝2012年伦敦奥运会。
-

- 标题:XRP价格在推出XRP ETF之后的价格略有上涨,因为OT为重大突破做准备
- 2025-04-29 04:55:12
- 价格正试图高于关键范围,这可能会在2025年恢复新的ATH的可能性
-

-

- 来自2012年伦敦奥运会范围的“超稀有” 50p硬币的价值超过3700英镑
- 2025-04-29 04:50:12
- 皇家造币厂于2011年创建了一系列50便士硬币,以庆祝2012年伦敦奥运会。
-

- “超稀有” 50p硬币,价值超过3,700英镑
- 2025-04-29 04:50:12
- 每个硬币都描绘了一项不同的运动,包括足球,柔道,射箭和帆船。
-

- 标题:Coinshares说,上周对数字资产工具的机构投资几乎创造了新的记录
- 2025-04-29 04:45:12
- 加密资产管理公司Coinshares表示,上周对数字资产工具的机构投资几乎创造了新的记录。
-

-


