 |
|
 |
|
 |
|
 |
|
 |
|
 |
|
 |
|
 |
|
 |
|
 |
|
 |
|
 |
|
 |
|
 |
|
 |
|
FET 가격은 지난 몇 달 동안 꾸준한 하락세에 갇혔습니다. 2024 년 12 월 말부터 가격은 일관된 낮은 최고점과 낮은 최저점을 형성했습니다.

The price of FET, traded on Binance, has spent the past few months forming lower highs and lower lows, indicating a downtrend. Since December 2024, the token has been struggling to break free from a descending trendline that provides immediate resistance.
Binance와 거래 된 FET의 가격은 지난 몇 달 동안 낮은 최고점과 낮은 최저치를 형성하여 하락세를 나타냅니다. 2024 년 12 월 이래로,이 토큰은 즉각적인 저항을 제공하는 내림차순 트렌드 라인에서 벗어나기 위해 고군분투하고 있습니다.
However, in mid-April, FET broke out of this trendline with a strong bullish candle, shifting the market structure. After the breakout, the token began forming higher highs and higher lows for the first time in months.
그러나 4 월 중순에 FET는 강한 낙관적 양초 로이 트렌드 라인에서 나와 시장 구조를 바꾸었다. 탈주 후, 토큰은 몇 달 만에 처음으로 더 높은 최고점과 높은 최저를 형성하기 시작했습니다.
As of press time, FET is trading at around $0.73, bouncing from earlier 2025 lows and approaching key resistance levels that could decide the next major move.
프레스 타임 현재 FET는 약 $ 0.73로 거래되어 2025 년 초에서 튀어 나와 다음 주요 움직임을 결정할 수있는 주요 저항 수준에 접근하고 있습니다.
Artificial Superintelligence Alliance (FET) Chart: Key Levels to Watch
인공 수퍼 인텔리전스 얼라이언스 (FET) 차트 : 시청의 주요 레벨
As the breakout zone was hit with strong momentum, the price quickly moved toward the $0.74 resistance area. A confirmed close above $0.74-$0.75 is needed to open the door to higher targets near $0.90 and $1.00.
브레이크 아웃 존이 강한 추진력으로 타격을 받으면서 가격은 $ 0.74 저항 영역으로 빠르게 이동했습니다. $ 0.90 및 $ 1.00 근처의 높은 목표에 대한 문을 열기 위해서는 $ 0.74- $ 0.75 이상의 확인이 필요합니다.
The $0.68-$0.70 range has emerged as short-term support following the breakout. This area was previously a resistance zone but flipped into support after the breakout in April.
$ 0.68- $ 0.70 범위는 탈주 후 단기 지원으로 부상했습니다. 이 지역은 이전에 저항 구역 이었지만 4 월 브레이크 아웃 이후 지원에 빠졌습니다.
Moreover, the $0.55-$0.58 zone provides stronger support, aligning with the earlier breakout retest level.
또한, $ 0.55- $ 0.58 구역은 이전의 브레이크 아웃리스트 레벨과 일치하는 더 강력한 지원을 제공합니다.
Major support is also seen between $0.33 and $0.37, where FET previously formed a solid bottom before launching the current rally. Maintaining these support zones is crucial for preserving the bullish setup.
주요 지원은 또한 $ 0.33에서 $ 0.37 사이에 나타납니다. 여기서 FET는 이전에 현재 랠리를 시작하기 전에 견고한 바닥을 형성했습니다. 이러한 지원 구역을 유지하는 것은 강세 설정을 보존하는 데 중요합니다.
Key Resistance Levels:
주요 저항 수준 :
Immediately, resistance is seen at the 38.2 percent Fibonacci retracement level of the 2023 low to 2024 high at around $0.78.
즉시, 저항은 2023 년 최대 0.78 달러로 2023 년 최대 2024 년의 38.2 %의 피브보나치 되돌아 가기 수준에서 볼 수 있습니다.
Next, traders are eyeing the 50 percent Fibonacci retracement level at $0.88.
다음으로, 상인들은 50 %의 피보나키 뒷받침 수준을 $ 0.88로 시주하고 있습니다.
The 200-day SMA, currently at around $1.06, provides strong long-term resistance.
현재 약 $ 1.06 인 200 일 SMA는 강력한 장기 저항을 제공합니다.
Key Support Levels:
주요 지원 수준 :
Short-term support is at the 0.236 percent Fibonacci retracement level at around $0.68.
단기 지원은 약 0.68 달러로 0.236 % 피보나키 후 되돌아 가기도합니다.
The 100-percent Fibonacci extension from the breakout point to the breakout retest is seen at $0.55, providing support during the retest.
브레이크 아웃 포인트에서 브레이크 아웃 리테스트까지 100 %의 Fibonacci 확장은 $ 0.55로 표시되며, 재시험 중에 지원을 제공합니다.
Stronger support is at the 38.2 percent Fibonacci retracement level, which coincides with the 2024 low, around the $0.33-$0.37 zone.
더 강력한 지원은 38.2 %의 피보나키 후 되돌아가되며, 이는 2024 년 최저치와 일치하며 $ 0.33- $ 0.37 구역.
Positive Market Structure Shift But Some Caution Remains
긍정적 인 시장 구조 이동이 있지만 약간의주의가 남아 있습니다
The structure has shifted positively with the breakout and the formation of higher highs and higher lows. However, traders remain cautious about the possibility of a minor pullback.
구조는 고도로 높은 최고점 및 더 높은 최저의 형성으로 긍정적으로 이동했습니다. 그러나 거래자들은 사소한 풀백의 가능성에 대해 신중합니다.
A minor cooling-off phase toward $0.68-$0.70 is considered healthy for sustaining bullish momentum.
$ 0.68- $ 0.70에 대한 사소한 냉각 단계는 강세 모멘텀을 유지하기 위해 건강한 것으로 간주됩니다.
If the buyers can maintain the price above the breakout zone and the 0.236 percent Fibonacci retracement level, it suggests that the sellers are losing strength.
구매자가 브레이크 아웃 존 이상과 0.236 % Fibonacci retression 수준을 유지할 수 있다면 판매자가 강도를 잃고 있음을 시사합니다.
If the sellers manage to break the price back below the breakout zone and the 100 percent Fibonacci extension, it may indicate that the buyers are becoming exhausted.
판매자가 브레이크 아웃 존과 100 % Fibonacci Extension 아래로 가격을 돌려 주면 구매자가 소진되고 있음을 나타낼 수 있습니다.
If the price breaks above the 200-day SMA and sustains above it, it would be a strong indication of a macro bullish trend.
가격이 200 일 SMA 이상으로 파괴되어 그 위에 유지되면 거시적 강세 추세를 강력하게 표시 할 것입니다.
부인 성명:info@kdj.com
제공된 정보는 거래 조언이 아닙니다. kdj.com은 이 기사에 제공된 정보를 기반으로 이루어진 투자에 대해 어떠한 책임도 지지 않습니다. 암호화폐는 변동성이 매우 높으므로 철저한 조사 후 신중하게 투자하는 것이 좋습니다!
본 웹사이트에 사용된 내용이 귀하의 저작권을 침해한다고 판단되는 경우, 즉시 당사(info@kdj.com)로 연락주시면 즉시 삭제하도록 하겠습니다.
-

- 1 분기의 약세 정서는 끝났다
- 2025-04-29 05:05:12
- 이 황소주기의 경우와 마찬가지로 Solana Meme Coins는 처음으로 강세를 보였습니다.
-

-

-

-

-

-

-

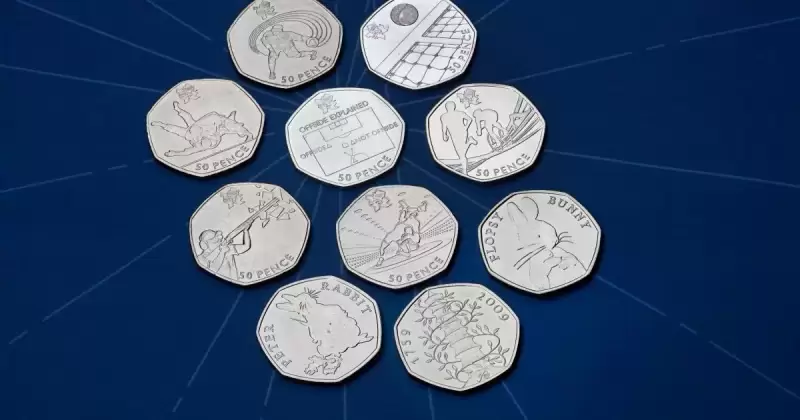
- 3,700 파운드 이상의 가치가있는 "Ultra Rare"50p 코인
- 2025-04-29 04:50:12
- 각 동전은 축구, 유도, 양궁 및 항해를 포함한 다른 스포츠를 묘사했습니다.
-


