-
 Bitcoin
 $106,754.6083
1.33% -
 Ethereum
 $2,625.8249
3.80% -
 Tether USDt
 $1.0001
-0.03% -
 XRP
XRP $2.1891
1.67% -
 BNB
BNB $654.5220
0.66% -
 Solana
 $156.9428
7.28% -
 USDC
USDC $0.9998
0.00% -
 Dogecoin
 $0.1780
1.14% -
 TRON
TRON $0.2706
-0.16% -
 Cardano
 $0.6470
2.77% -
 Hyperliquid
 $44.6467
10.24% -
 Sui
Sui $3.1128
3.86% -
 Bitcoin Cash
 $455.7646
3.00% -
 Chainlink
 $13.6858
4.08% -
 UNUS SED LEO
 $9.2682
0.21% -
 Avalanche
 $19.7433
3.79% -
 Stellar
 $0.2616
1.64% -
 Toncoin
 $3.0222
2.19% -
 Shiba Inu
 $0.0...01220
1.49% -
 Hedera
 $0.1580
2.75% -
 Litecoin
 $87.4964
2.29% -
 Polkadot
 $3.8958
3.05% -
 Ethena USDe
 $1.0000
-0.04% -
 Monero
 $317.2263
0.26% -
 Bitget Token
 $4.5985
1.68% -
 Dai
Dai $0.9999
0.00% -
 Pepe
Pepe $0.0...01140
2.44% -
 Uniswap
 $7.6065
5.29% -
 Pi
Pi $0.6042
-2.00% -
 Aave
Aave $289.6343
6.02%
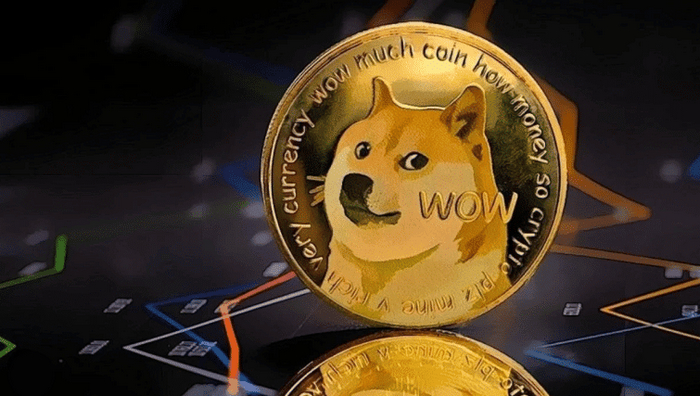
How to develop an investment strategy for Dogecoin?
To develop a comprehensive Dogecoin investment strategy, it's crucial to establish financial objectives, research the cryptocurrency thoroughly, select a trustworthy platform, define an affordable budget, and regularly monitor investments amid market fluctuations.
Oct 31, 2024 at 05:58 pm

How to Develop an Investment Strategy for Dogecoin
Dogecoin (DOGE) is a decentralized cryptocurrency that has gained significant attention in recent years. Unlike most other cryptocurrencies, Dogecoin was created as a joke in 2013. Despite its humble origins, Dogecoin has become a popular investment, particularly among retail investors. If you're considering investing in Dogecoin, it's important to develop a solid investment strategy. Here are five steps to help you get started:
1. Determine Your Investment Goals
Before you start investing, it's important to determine your investment goals. Are you saving for retirement, a down payment on a house, or something else? Once you know what you're saving for, you can start to develop an investment strategy that aligns with your goals.
2. Do Your Research
Before you invest any money in Dogecoin, it's important to do your research and understand the risks involved. Learn about the history of Dogecoin, its current market cap, and its future potential. You should also be aware of the risks associated with cryptocurrency investing, such as price volatility and hacking.
3. Choose an Investment Platform
Once you've done your research, it's time to choose an investment platform. There are a number of different platforms that allow you to buy and sell Dogecoin. Do your research and choose a reputable platform that meets your needs.
4. Set a Budget
Setting a budget is one of the most important steps in developing an investment strategy. It's important to invest only what you can afford to lose. Determine how much money you can afford to invest in Dogecoin and stick to your budget.
5. Monitor Your Investment
Once you've invested in Dogecoin, it's important to monitor your investment on a regular basis. Keep track of the price of Dogecoin and make adjustments to your strategy as needed. You should also be aware of any news or events that could affect the price of Dogecoin.
Conclusion
Investing in Dogecoin can be a rewarding experience, but it's important to do your research and develop a solid investment strategy before you start investing. By following these five steps, you can increase your chances of success in the volatile world of cryptocurrency investing.
Disclaimer:info@kdj.com
The information provided is not trading advice. kdj.com does not assume any responsibility for any investments made based on the information provided in this article. Cryptocurrencies are highly volatile and it is highly recommended that you invest with caution after thorough research!
If you believe that the content used on this website infringes your copyright, please contact us immediately (info@kdj.com) and we will delete it promptly.
- 2025-W Uncirculated American Gold Eagle and Dr. Vera Rubin Quarter Mark New Products
- 2025-06-13 06:25:13
- Ruvi AI (RVU) Leverages Blockchain and Artificial Intelligence to Disrupt Marketing, Entertainment, and Finance
- 2025-06-13 07:05:12
- H100 Group AB Raises 101 Million SEK (Approximately $10.6 Million) to Bolster Bitcoin Reserves
- 2025-06-13 06:25:13
- Galaxy Digital CEO Mike Novogratz Says Bitcoin Will Replace Gold and Go to $1,000,000
- 2025-06-13 06:45:13
- Trust Wallet Token (TWT) Price Drops 5.7% as RWA Integration Plans Ignite Excitement
- 2025-06-13 06:45:13
- Ethereum (ETH) Is in the Second Phase of a Three-Stage Market Cycle
- 2025-06-13 07:25:13
Related knowledge

How to use K-line charts to analyze the cryptocurrency market: detailed steps and common misunderstandings
Jun 16,2025 at 01:42pm
Understanding the Basics of K-line Charts in Cryptocurrency TradingK-line charts, also known as candlestick charts, are one of the most widely used tools for analyzing price movements in financial markets, including cryptocurrencies. These charts provide a visual representation of price action over specific time intervals and help traders make informed ...

Cryptocurrency K-line chart technical analysis manual: Learn these methods to increase your chances of making a profit
Jun 11,2025 at 11:21pm
Understanding the Basics of K-line ChartsK-line charts, also known as candlestick charts, are one of the most widely used tools in cryptocurrency trading. Each K-line represents a specific time period and provides information about the open, high, low, and close prices during that interval. The body of the candle shows the relationship between the openi...

The Importance of K-line Chart Analysis in Cryptocurrency Trading: From Theory to Practical Cases
Jun 11,2025 at 04:56pm
Understanding the Basics of K-line ChartsK-line charts, also known as candlestick charts, are a visual representation of price movements over specific time intervals. Each K-line encapsulates four critical data points: the opening price, closing price, highest price, and lowest price within a given timeframe. These charts originated in Japan during the ...

Cryptocurrency K-line Chart Interpretation Guide: How Novices Can Quickly Master the Basics of Technical Analysis
Jun 10,2025 at 08:56pm
Understanding the Basics of K-line ChartsK-line charts, also known as candlestick charts, are one of the most widely used tools in cryptocurrency trading for analyzing price movements. Each K-line represents a specific time period and shows the opening, closing, high, and low prices during that interval. For novices, grasping how to read these elements ...

How to Analyze Short-term and Long-term Trends of Cryptocurrencies through K-line Charts: A Complete Guide
Jun 15,2025 at 12:49pm
Understanding the Basics of K-line ChartsK-line charts, also known as candlestick charts, are essential tools used in cryptocurrency trading to visualize price movements over time. Each candlestick represents a specific time interval and contains four key data points: open, high, low, and close. The body of the candle shows the range between the opening...

Introduction to Cryptocurrency K-line Charts: How to Use Technical Analysis to Optimize Trading Decisions
Jun 12,2025 at 03:56pm
Understanding the Basics of K-line ChartsK-line charts, also known as candlestick charts, are one of the most essential tools used in cryptocurrency trading. Originating from Japan, these charts visually represent price movements over specific time intervals. Each candlestick displays four key pieces of information: the opening price, closing price, hig...

How to use K-line charts to analyze the cryptocurrency market: detailed steps and common misunderstandings
Jun 16,2025 at 01:42pm
Understanding the Basics of K-line Charts in Cryptocurrency TradingK-line charts, also known as candlestick charts, are one of the most widely used tools for analyzing price movements in financial markets, including cryptocurrencies. These charts provide a visual representation of price action over specific time intervals and help traders make informed ...

Cryptocurrency K-line chart technical analysis manual: Learn these methods to increase your chances of making a profit
Jun 11,2025 at 11:21pm
Understanding the Basics of K-line ChartsK-line charts, also known as candlestick charts, are one of the most widely used tools in cryptocurrency trading. Each K-line represents a specific time period and provides information about the open, high, low, and close prices during that interval. The body of the candle shows the relationship between the openi...

The Importance of K-line Chart Analysis in Cryptocurrency Trading: From Theory to Practical Cases
Jun 11,2025 at 04:56pm
Understanding the Basics of K-line ChartsK-line charts, also known as candlestick charts, are a visual representation of price movements over specific time intervals. Each K-line encapsulates four critical data points: the opening price, closing price, highest price, and lowest price within a given timeframe. These charts originated in Japan during the ...

Cryptocurrency K-line Chart Interpretation Guide: How Novices Can Quickly Master the Basics of Technical Analysis
Jun 10,2025 at 08:56pm
Understanding the Basics of K-line ChartsK-line charts, also known as candlestick charts, are one of the most widely used tools in cryptocurrency trading for analyzing price movements. Each K-line represents a specific time period and shows the opening, closing, high, and low prices during that interval. For novices, grasping how to read these elements ...

How to Analyze Short-term and Long-term Trends of Cryptocurrencies through K-line Charts: A Complete Guide
Jun 15,2025 at 12:49pm
Understanding the Basics of K-line ChartsK-line charts, also known as candlestick charts, are essential tools used in cryptocurrency trading to visualize price movements over time. Each candlestick represents a specific time interval and contains four key data points: open, high, low, and close. The body of the candle shows the range between the opening...

Introduction to Cryptocurrency K-line Charts: How to Use Technical Analysis to Optimize Trading Decisions
Jun 12,2025 at 03:56pm
Understanding the Basics of K-line ChartsK-line charts, also known as candlestick charts, are one of the most essential tools used in cryptocurrency trading. Originating from Japan, these charts visually represent price movements over specific time intervals. Each candlestick displays four key pieces of information: the opening price, closing price, hig...
See all articles


