-
 Bitcoin
 $118,841.1054
1.02% -
 Ethereum
 $3,364.2689
7.44% -
 XRP
XRP $3.0337
3.93% -
 Tether USDt
 $1.0004
0.04% -
 BNB
BNB $708.2059
2.49% -
 Solana
 $173.2385
5.74% -
 USDC
USDC $0.9999
-0.01% -
 Dogecoin
 $0.2121
6.85% -
 TRON
TRON $0.3090
2.81% -
 Cardano
 $0.7628
2.25% -
 Hyperliquid
 $46.8391
-2.08% -
 Stellar
 $0.4537
0.15% -
 Sui
Sui $3.9529
-2.88% -
 Chainlink
 $16.6414
3.72% -
 Hedera
 $0.2354
1.52% -
 Bitcoin Cash
 $499.1285
0.43% -
 Avalanche
 $22.6400
0.57% -
 Shiba Inu
 $0.0...01438
4.88% -
 UNUS SED LEO
 $8.8507
-0.64% -
 Toncoin
 $3.1498
2.35% -
 Litecoin
 $97.4954
1.21% -
 Polkadot
 $4.1541
1.50% -
 Monero
 $331.4406
-1.03% -
 Pepe
Pepe $0.0...01350
5.24% -
 Uniswap
 $8.9103
-5.01% -
 Bitget Token
 $4.7540
4.51% -
 Dai
Dai $0.9999
-0.02% -
 Ethena USDe
 $1.0008
0.00% -
 Aave
Aave $322.3328
-1.63% -
 Bittensor
 $431.8026
-0.50%
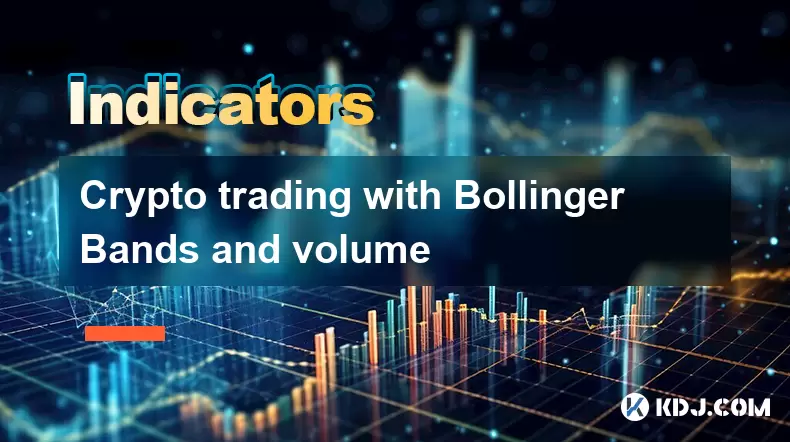
Crypto trading with Bollinger Bands and volume
Bollinger Bands and volume analysis help crypto traders identify high-probability entry and exit points by confirming trends and volatility.
Jul 12, 2025 at 05:00 am

Understanding Bollinger Bands in Crypto Trading
Bollinger Bands are a widely used technical analysis tool developed by John Bollinger. They consist of three lines: a simple moving average (SMA), typically set at 20 periods, and two standard deviation bands above and below the SMA. In crypto trading, these bands help identify overbought or oversold conditions.
The upper band indicates potential resistance levels, while the lower band signals support areas. When price touches or moves beyond the upper band, it may suggest that the asset is overbought. Conversely, when price hits or dips below the lower band, it could indicate an oversold condition.
Traders often use Bollinger Bands to gauge volatility. When the bands contract, known as the "squeeze," it suggests decreasing volatility, which can precede a significant price move. When the bands widen, it reflects increased volatility.
The Role of Volume in Cryptocurrency Trading
Volume is a critical metric in crypto trading that represents the total number of coins or tokens traded during a specific period. High volume usually confirms strong trends, while low volume might signal weak interest or potential reversals.
Incorporating volume with Bollinger Bands provides traders with more reliable signals. For example, if price breaks out of the upper band with high volume, it can confirm a bullish trend continuation. On the other hand, if price reaches the upper band but volume remains low, it might be a false breakout.
Volume also helps validate candlestick patterns and chart formations. A breakout from consolidation supported by significant volume increase is more likely to succeed than one with muted volume.
Combining Bollinger Bands and Volume for Entry Signals
To generate high-probability trade setups in cryptocurrency markets, traders often combine Bollinger Bands with volume analysis. Here’s how you can do that:
- Look for price touching or breaking the upper or lower Bollinger Band
- Confirm the move with a spike in trading volume
- Watch for candlestick patterns such as engulfing candles or pin bars near the bands
- Ensure that the moving average (middle band) aligns with the direction of the trend
For instance, if Bitcoin's price touches the lower Bollinger Band and volume surges significantly, it might signal a strong buying opportunity, especially if the candle closes above the middle band.
Similarly, if Ethereum’s price hits the upper Bollinger Band and volume jumps, it might indicate a continuation of the uptrend, offering a valid entry point for long positions.
Exit Strategies Using Bollinger Bands and Volume Confirmation
Knowing when to exit a trade is just as important as knowing when to enter. Traders can use Bollinger Bands and volume data to set dynamic profit targets and stop-loss points.
One approach involves exiting when price returns to the middle band, particularly in trending markets. Another method is trailing the stop based on the distance between the price and the lower or upper band, depending on the trade direction.
Volume can assist in determining whether to hold or close a position. If price approaches the upper band but volume declines, it may indicate weakening momentum, prompting a trader to consider closing part or all of the position.
Additionally, traders should monitor for divergence between volume and price. If price makes a new high but volume fails to increase, it may signal a reversal is imminent, warranting an early exit.
Backtesting Your Strategy with Historical Data
Before applying any strategy to live trading, it's crucial to backtest using historical data. This allows traders to assess the effectiveness of combining Bollinger Bands and volume across various market conditions.
Choose a crypto pair like BTC/USDT or ETH/USDT and gather historical price and volume data. Apply the Bollinger Bands indicator (default settings: 20-period SMA, 2 standard deviations) and overlay volume bars.
Mark instances where price touched or broke a band with volume confirmation and track how those trades would have performed. Use tools like TradingView or Python libraries like pandas and mplfinance to automate this process.
Adjust your parameters based on performance. Some traders tweak the period length or standard deviation multiplier to suit specific assets or timeframes.
Risk Management Considerations
Even the most effective strategies can fail without proper risk management. Always define your maximum risk per trade, ideally not exceeding 1–2% of your trading capital.
Set stop-loss orders below key support levels or above resistance zones identified through Bollinger Bands. Consider using trailing stops to lock in profits as the trade progresses.
Never ignore macroeconomic events or news releases that can cause sudden spikes in volatility. Even if your technical indicators align perfectly, unexpected developments can quickly reverse positions.
Use position sizing calculators to determine how many units to buy or sell based on your account size and stop-loss level. This ensures consistency and prevents emotional decision-making.
Frequently Asked Questions
Q: Can Bollinger Bands be used alone for crypto trading decisions?
While Bollinger Bands provide valuable insights into price volatility and potential reversal zones, they work best when combined with other tools like volume, RSI, or MACD. Using them alone may result in false signals, especially in highly volatile crypto markets.
Q: How does volume help in confirming breakouts in crypto charts?
Volume acts as a validation tool. A breakout accompanied by high volume suggests strong market participation and increases the likelihood of the move continuing. Low-volume breakouts often lack conviction and may lead to fakeouts or quick reversals.
Q: What timeframes are best suited for using Bollinger Bands and volume together in crypto trading?
Shorter timeframes like 15-minute or 1-hour charts are popular among day traders, while swing traders often prefer 4-hour or daily charts. The key is to adjust the Bollinger Band settings and volume thresholds according to the timeframe and asset being traded.
Q: Is it possible to automate trading using Bollinger Bands and volume signals?
Yes, many trading platforms allow users to create custom scripts or bots that execute trades based on predefined rules involving Bollinger Bands and volume thresholds. However, thorough testing and optimization are essential before deploying such systems in live markets.
Disclaimer:info@kdj.com
The information provided is not trading advice. kdj.com does not assume any responsibility for any investments made based on the information provided in this article. Cryptocurrencies are highly volatile and it is highly recommended that you invest with caution after thorough research!
If you believe that the content used on this website infringes your copyright, please contact us immediately (info@kdj.com) and we will delete it promptly.
- Bitcoin Trading Volume in Q2 2025: A New York Minute
- 2025-07-17 14:30:12
- Bitcoin, SpacePay, and Your Cappuccino: The Future of Crypto Payments is Here!
- 2025-07-17 14:30:12
- Top Cryptos: Dogwifhat's Comeback, Arctic Pablo's Presale Adventure
- 2025-07-17 14:50:11
- Morgan vs. Peace: The US Mint's Silver Showdown
- 2025-07-17 14:50:11
- Ethereum Rising: Breaking $3400 – What's Fueling the Surge?
- 2025-07-17 14:55:11
- Bitcoin, Selling, and Happiness: A Contrarian's View from a New Yorker
- 2025-07-17 15:10:11
Related knowledge

Advanced RSI strategies for crypto
Jul 13,2025 at 11:01am
Understanding the Basics of RSI in Cryptocurrency TradingThe Relative Strength Index (RSI) is a momentum oscillator used to measure the speed and chan...

Crypto RSI for day trading
Jul 12,2025 at 11:14am
Understanding RSI in the Context of Cryptocurrency TradingThe Relative Strength Index (RSI) is a momentum oscillator used to measure the speed and cha...

Crypto RSI for scalping
Jul 12,2025 at 11:00pm
Understanding RSI in the Context of Crypto TradingThe Relative Strength Index (RSI) is a momentum oscillator widely used by traders to measure the spe...

What does an RSI of 30 mean in crypto
Jul 15,2025 at 07:07pm
Understanding RSI in Cryptocurrency TradingRelative Strength Index (RSI) is a momentum oscillator widely used in cryptocurrency trading to measure the...

What does an RSI of 70 mean in crypto
Jul 13,2025 at 06:07pm
Understanding the RSI Indicator in Cryptocurrency TradingThe Relative Strength Index (RSI) is a widely used technical analysis tool that helps traders...

Does RSI work in a bear market for crypto
Jul 16,2025 at 01:36pm
Understanding RSI in Cryptocurrency TradingThe Relative Strength Index (RSI) is a momentum oscillator used by traders to measure the speed and change ...

Advanced RSI strategies for crypto
Jul 13,2025 at 11:01am
Understanding the Basics of RSI in Cryptocurrency TradingThe Relative Strength Index (RSI) is a momentum oscillator used to measure the speed and chan...

Crypto RSI for day trading
Jul 12,2025 at 11:14am
Understanding RSI in the Context of Cryptocurrency TradingThe Relative Strength Index (RSI) is a momentum oscillator used to measure the speed and cha...

Crypto RSI for scalping
Jul 12,2025 at 11:00pm
Understanding RSI in the Context of Crypto TradingThe Relative Strength Index (RSI) is a momentum oscillator widely used by traders to measure the spe...

What does an RSI of 30 mean in crypto
Jul 15,2025 at 07:07pm
Understanding RSI in Cryptocurrency TradingRelative Strength Index (RSI) is a momentum oscillator widely used in cryptocurrency trading to measure the...

What does an RSI of 70 mean in crypto
Jul 13,2025 at 06:07pm
Understanding the RSI Indicator in Cryptocurrency TradingThe Relative Strength Index (RSI) is a widely used technical analysis tool that helps traders...

Does RSI work in a bear market for crypto
Jul 16,2025 at 01:36pm
Understanding RSI in Cryptocurrency TradingThe Relative Strength Index (RSI) is a momentum oscillator used by traders to measure the speed and change ...
See all articles


