


-
 Bitcoin
 $108,810.2974
0.81% - Ethereum
$2,547.2589
2.01% - Tether USDt
$1.0003
0.00% - XRP
$2.2725
2.39% - BNB
$662.9418
1.38% - Solana
$151.6325
3.50% - USDC
$1.0000
-0.01% - TRON
$0.2849
0.15% - Dogecoin
$0.1705
4.70% - Cardano
$0.5855
2.00% - Hyperliquid
$39.3158
1.30% - Sui
$2.9100
0.97% - Bitcoin Cash
$495.1485
2.64% - Chainlink
$13.4389
2.55% - UNUS SED LEO
$9.0260
0.06% - Avalanche
$18.2104
2.50% - Stellar
$0.2440
3.01% - Toncoin
$2.9143
6.06% - Shiba Inu
$0.0...01181
3.25% - Hedera
$0.1578
0.99% - Litecoin
$87.8055
1.82% - Monero
$317.3492
1.14% - Polkadot
$3.3902
1.63% - Dai
$0.9999
-0.01% - Ethena USDe
$1.0001
-0.01% - Bitget Token
$4.4073
0.41% - Uniswap
$7.3972
7.15% - Pepe
$0.0...01003
4.10% - Aave
$275.5648
2.57% - Pi
$0.4610
-0.26%


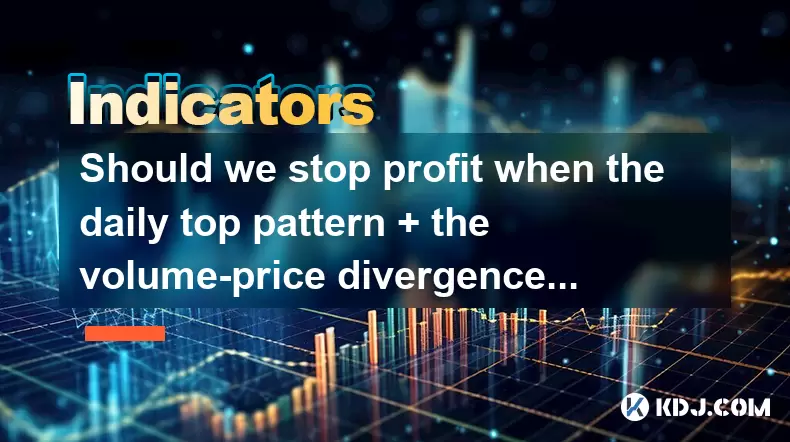
Should we stop profit when the daily top pattern + the volume-price divergence of the time-sharing chart?
The daily top pattern combined with volume-price divergence signals a potential trend reversal, offering traders a strategic opportunity to secure profits or initiate short positions.
Jul 06, 2025 at 05:42 pm
Understanding the Daily Top Pattern in Cryptocurrency Trading
In cryptocurrency trading, the daily top pattern refers to a specific candlestick formation that appears at the peak of an uptrend. This pattern typically indicates a potential reversal from bullish to bearish sentiment. Traders often use this as a signal to consider exiting long positions or initiating short trades. The daily top pattern can be identified by observing a candle with a relatively high close followed by a sharp decline in price action, forming a visible peak on the chart.
When analyzing this pattern, it's essential to combine it with other technical indicators for more accurate decision-making. One such complementary indicator is volume-price divergence, especially when observed in time-sharing charts like 1-minute or 5-minute intervals.
Key Takeaway:
The daily top pattern serves as a warning sign of weakening buyer momentum and potential trend reversal.Decoding Volume-Price Divergence in Time-Sharing Charts
Volume-price divergence occurs when the volume does not confirm the price movement. For instance, if the price continues to rise but the trading volume starts to decline, it signals a lack of conviction among buyers. In the context of time-sharing charts (e.g., intraday charts), this divergence becomes more sensitive and immediate compared to daily or weekly charts.
To identify volume-price divergence, follow these steps:
- Observe rising prices across consecutive candles.
- Check if the corresponding volume bars are decreasing during the same period.
- Look for a clear divergence where higher highs in price are met with lower highs in volume.
This divergence suggests that fewer traders are willing to push the price higher, indicating a possible exhaustion of the bullish move. When combined with the daily top pattern, the signal becomes stronger for profit-taking or position closing.
Critical Insight:
Volume-price divergence in time-sharing charts provides early signs of trend weakness before price reflects the change.Combining Daily Top Pattern with Volume-Price Divergence
When both the daily top pattern and volume-price divergence appear simultaneously, they form a powerful confluence for decision-making. Here’s how you can interpret their joint appearance:
- Daily Top Pattern shows structural weakness at the price peak.
- Volume-Price Divergence confirms underlying strength erosion through declining participation.
For example, suppose Bitcoin reaches a new daily high on a 1-hour chart, forming a visible daily top pattern, but the volume during this rally is significantly lower than previous rallies. This combination strongly suggests that the upward move lacks real buying pressure and may reverse soon.
Traders should pay attention to these dual signals when managing open positions, especially those entered earlier in the uptrend. It is often prudent to consider taking profits or tightening stop-loss orders at this stage.
Important Note:
The synergy between the daily top pattern and volume divergence increases the reliability of the trade signal.Practical Steps for Profit-Taking Based on These Signals
If you're monitoring your crypto positions and detect both the daily top pattern and volume-price divergence, here’s a step-by-step guide to manage your exit strategy effectively:
- Confirm the presence of the daily top pattern on the daily chart or relevant timeframe.
- Switch to a shorter timeframe (e.g., 5-minute or 15-minute chart) to analyze volume-price divergence.
- Ensure that the volume bars are consistently declining while the price is still rising or peaking.
- Place a sell order slightly below the recent swing high to secure profits before a potential drop.
- Consider using a trailing stop loss if the price hasn't shown clear reversal yet.
These steps help in locking in gains without waiting for a full reversal, which might come too late after a rapid dump. It's crucial to act swiftly once these patterns align, as crypto markets can turn quickly due to high volatility.
Actionable Tip:
Use limit orders to exit partially or fully based on the strength of the confluence between the two signals.Common Mistakes to Avoid When Using These Indicators
Despite their effectiveness, many traders make errors when interpreting or applying the daily top pattern and volume-price divergence:
- Failing to check multiple timeframes: Relying solely on one chart can lead to false signals.
- Ignoring broader market conditions: Even strong technical setups can fail if there’s a sudden news event or macro shift.
- Misidentifying the daily top pattern: Confusing it with normal pullbacks or consolidation phases.
- Overreacting to minor divergences: Not every small volume dip during a rally indicates a reversal.
Avoiding these pitfalls requires discipline, patience, and proper backtesting of strategies involving these indicators. It's also wise to use additional tools like moving averages or RSI to filter out noise.
Caution:
Do not base critical decisions solely on one or two indicators without confirming via other methods.Frequently Asked Questions
Q: Can I apply the daily top pattern and volume divergence analysis to altcoins?
Yes, these patterns are applicable to any liquid cryptocurrency with sufficient volume data. However, ensure that the altcoin has reliable charting tools and consistent trading activity.
Q: How do I differentiate between a true daily top and a temporary high?
A true daily top pattern usually comes with increased volatility, rejection candles (like shooting stars or hanging men), and often precedes a significant pullback. Temporary highs may lack volume confirmation or show no clear reversal structure.
Q: Is volume divergence more effective in certain timeframes?
While volume divergence can occur in all timeframes, it tends to be more reliable in shorter timeframes like 15-minute or 1-hour charts when used alongside daily-level patterns.
Q: Should I always exit my entire position when these signals align?
Not necessarily. Depending on your risk tolerance, you may choose to take partial profits while keeping a portion open for further upside, provided the trend remains intact.
Disclaimer:info@kdj.com
The information provided is not trading advice. kdj.com does not assume any responsibility for any investments made based on the information provided in this article. Cryptocurrencies are highly volatile and it is highly recommended that you invest with caution after thorough research!
If you believe that the content used on this website infringes your copyright, please contact us immediately (info@kdj.com) and we will delete it promptly.


- Litecoin Breakout Watch: What Traders Need to Know Now
- 2025-07-06 16:50:13
- Bitcoin, Solana, Ethereum: Decoding the Latest Buzz on the Blockchain
- 2025-07-06 16:50:13
- Widnes Resident's 50p Could Be Your Ticket to Easy Street: Rare Coin Mania!
- 2025-07-06 16:55:13
- Bitcoin, Solaris Presale, and Token Rewards: What's the Buzz?
- 2025-07-06 16:55:13
- Ethereum Under Pressure: Price Drop Amid Global Uncertainties
- 2025-07-06 17:00:13
- XRP, SEC Case, and Prosperity: A New Era for XRP Holders?
- 2025-07-06 17:10:13
Related knowledge

How to spot manipulation on the Dogecoin chart
Jul 06,2025 at 12:35pm
Understanding the Basics of Chart ManipulationChart manipulation in the cryptocurrency space, particularly with Dogecoin, refers to artificial price movements caused by coordinated trading activities rather than genuine market demand. These manipulations are often executed by large holders (commonly known as whales) or organized groups aiming to mislead...

What is the significance of a Dogecoin engulfing candle pattern
Jul 06,2025 at 06:36am
Understanding the Engulfing Candle Pattern in CryptocurrencyThe engulfing candle pattern is a significant technical analysis tool used by traders to identify potential trend reversals in financial markets, including cryptocurrencies like Dogecoin. This pattern typically consists of two candles: the first one is relatively small and indicates the current...

Dogecoin monthly chart analysis for long term investors
Jul 06,2025 at 10:08am
Understanding the Dogecoin Monthly ChartFor long-term investors, analyzing the monthly chart of Dogecoin (DOGE) provides a macro view of its price behavior over extended periods. The monthly chart captures major trends, key resistance and support levels, and potential reversal zones that are crucial for strategic investment planning. Unlike daily or hou...

How to manage risk using ATR on Dogecoin
Jul 06,2025 at 02:35am
Understanding ATR in Cryptocurrency TradingThe Average True Range (ATR) is a technical indicator used to measure market volatility. Originally developed for commodities, it has found widespread use in cryptocurrency trading due to the high volatility inherent in digital assets like Dogecoin (DOGE). The ATR calculates the average range of price movement ...

Setting up a Dogecoin trading strategy in Pinescript
Jul 06,2025 at 05:00pm
Understanding Dogecoin and Its Place in the Cryptocurrency MarketDogecoin (DOGE) is a decentralized, peer-to-peer cryptocurrency that was initially created as a joke but has since gained significant traction in the crypto market. Despite its humorous origins, Dogecoin has been adopted by a large community and supported by notable figures such as Elon Mu...

What is the best leading indicator for Dogecoin price movement
Jul 06,2025 at 06:00pm
Understanding Leading Indicators in CryptocurrencyIn the world of cryptocurrency trading, leading indicators play a crucial role in forecasting price movements before they occur. These tools are used by traders to anticipate potential market changes and make informed decisions. For Dogecoin (DOGE), which is known for its volatile nature and strong commu...
How to spot manipulation on the Dogecoin chart
Jul 06,2025 at 12:35pm
Understanding the Basics of Chart ManipulationChart manipulation in the cryptocurrency space, particularly with Dogecoin, refers to artificial price movements caused by coordinated trading activities rather than genuine market demand. These manipulations are often executed by large holders (commonly known as whales) or organized groups aiming to mislead...
What is the significance of a Dogecoin engulfing candle pattern
Jul 06,2025 at 06:36am
Understanding the Engulfing Candle Pattern in CryptocurrencyThe engulfing candle pattern is a significant technical analysis tool used by traders to identify potential trend reversals in financial markets, including cryptocurrencies like Dogecoin. This pattern typically consists of two candles: the first one is relatively small and indicates the current...
Dogecoin monthly chart analysis for long term investors
Jul 06,2025 at 10:08am
Understanding the Dogecoin Monthly ChartFor long-term investors, analyzing the monthly chart of Dogecoin (DOGE) provides a macro view of its price behavior over extended periods. The monthly chart captures major trends, key resistance and support levels, and potential reversal zones that are crucial for strategic investment planning. Unlike daily or hou...
How to manage risk using ATR on Dogecoin
Jul 06,2025 at 02:35am
Understanding ATR in Cryptocurrency TradingThe Average True Range (ATR) is a technical indicator used to measure market volatility. Originally developed for commodities, it has found widespread use in cryptocurrency trading due to the high volatility inherent in digital assets like Dogecoin (DOGE). The ATR calculates the average range of price movement ...
Setting up a Dogecoin trading strategy in Pinescript
Jul 06,2025 at 05:00pm
Understanding Dogecoin and Its Place in the Cryptocurrency MarketDogecoin (DOGE) is a decentralized, peer-to-peer cryptocurrency that was initially created as a joke but has since gained significant traction in the crypto market. Despite its humorous origins, Dogecoin has been adopted by a large community and supported by notable figures such as Elon Mu...
What is the best leading indicator for Dogecoin price movement
Jul 06,2025 at 06:00pm
Understanding Leading Indicators in CryptocurrencyIn the world of cryptocurrency trading, leading indicators play a crucial role in forecasting price movements before they occur. These tools are used by traders to anticipate potential market changes and make informed decisions. For Dogecoin (DOGE), which is known for its volatile nature and strong commu...
See all articles


