


-
 bitcoin
 $87959.907984 USD
1.34% - ethereum
$2920.497338 USD
3.04% - tether
$0.999775 USD
0.00% - xrp
$2.237324 USD
8.12% - bnb
$860.243768 USD
0.90% - solana
$138.089498 USD
5.43% - usd-coin
$0.999807 USD
0.01% - tron
$0.272801 USD
-1.53% - dogecoin
$0.150904 USD
2.96% - cardano
$0.421635 USD
1.97% - hyperliquid
$32.152445 USD
2.23% - bitcoin-cash
$533.301069 USD
-1.94% - chainlink
$12.953417 USD
2.68% - unus-sed-leo
$9.535951 USD
0.73% - zcash
$521.483386 USD
-2.87%


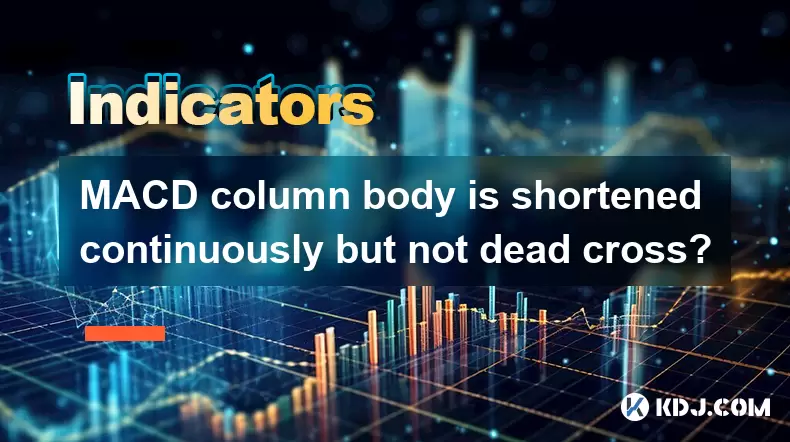
MACD column body is shortened continuously but not dead cross?
A shortening MACD histogram suggests weakening momentum, but without a dead cross or other confirming signals, it may not indicate an immediate trend reversal.
Jun 26, 2025 at 06:07 am
Understanding the MACD Indicator
The Moving Average Convergence Divergence (MACD) is a popular technical analysis tool used in cryptocurrency trading to identify potential trend reversals, momentum shifts, and entry or exit points. It consists of three main components: the MACD line, the signal line, and the MACD histogram (also known as the column). The histogram represents the difference between the MACD line and the signal line.
When traders observe the MACD histogram, they often look for patterns such as increasing or decreasing bar lengths to gauge momentum. A shortening MACD histogram suggests that the momentum behind the current trend is weakening. However, this does not necessarily indicate an immediate reversal unless accompanied by other signals like a dead cross.
What Is a Dead Cross in MACD?
A dead cross occurs when the MACD line crosses below the signal line, typically signaling a bearish shift in momentum. This crossover is considered a strong sell signal by many traders, especially if it happens after a prolonged uptrend. However, it's important to note that a dead cross isn't always required for a trend to weaken or reverse.
In some cases, even if the histogram bars are getting shorter—indicating diminishing bullish momentum—a dead cross may not occur immediately. This can happen during consolidation phases or when price action is range-bound. Traders must be cautious not to act prematurely based solely on the shortening histogram without confirming crossovers.
Why Does the MACD Histogram Shorten Without a Dead Cross?
There are several reasons why the MACD histogram might shorten continuously without forming a dead cross:
- Price Consolidation: When the market enters a sideways phase, the momentum slows down but doesn’t reverse. The histogram reflects this by showing smaller bars, indicating less divergence between the MACD line and the signal line.
- Volatility Reduction: Lower volatility can lead to smaller price movements, which in turn reduce the magnitude of the MACD histogram bars.
- Trend Exhaustion Without Reversal: Sometimes, a trend loses steam temporarily but regains strength afterward. In these scenarios, the histogram shrinks but doesn’t flip signs to trigger a crossover.
It's crucial to analyze the histogram in conjunction with price action and other indicators like RSI or volume to avoid false signals.
How to Interpret Continuous Shortening of the MACD Histogram
Interpreting a shrinking histogram involves more than just observing bar length; it requires context. Here’s how to approach it:
- Identify Trend Phase: Determine whether the asset is in an uptrend, downtrend, or consolidation. If the histogram shortens during an uptrend, it could suggest a temporary pullback rather than a full reversal.
- Look for Hidden Momentum Shifts: Even without a dead cross, subtle changes in the histogram slope can provide clues. For instance, a histogram that was rising sharply and then flattens may indicate waning bullish energy.
- Use Support/Resistance Levels: Combine MACD observations with key support and resistance levels. If the histogram shortens near a critical support level, it might hint at a potential bounce rather than a breakdown.
Avoid making decisions based solely on the histogram’s behavior unless there’s a confirmed crossover or other confirming signals.
Strategies for Trading Without a Dead Cross Confirmation
Some traders attempt to anticipate a dead cross by acting early when the histogram begins to shrink. While this can be profitable, it also increases the risk of entering a trade before the trend actually reverses. Consider these strategies:
- Wait for Confirmation: Only take action once a dead cross has occurred. This reduces the likelihood of false signals.
- Combine with Other Indicators: Use tools like Bollinger Bands, moving averages, or volume indicators to confirm the histogram’s message.
- Watch for Divergences: If the price continues to make higher highs while the MACD histogram makes lower highs, this is a bearish divergence and may precede a dead cross.
Remember, no single indicator should be used in isolation. Always seek confluence from multiple sources before executing trades.
Common Misinterpretations of MACD Histogram Behavior
Traders often misinterpret the meaning of a shrinking histogram. Some common errors include:
- Assuming a reversal is imminent simply because the histogram is shrinking
- Ignoring the importance of actual crossovers between the MACD and signal lines
- Overreacting to small fluctuations in the histogram, especially in low-volatility environments
To avoid these pitfalls, maintain a disciplined approach by setting clear rules for entry and exit based on multiple confirmations.
Frequently Asked Questions
Q1: Can the MACD histogram predict a dead cross before it happens?While the histogram may show signs of weakening momentum ahead of a dead cross, it cannot definitively predict one. The histogram reflects the distance between the MACD line and the signal line, so a consistent shortening can suggest that a crossover is approaching, but confirmation only comes after the actual cross occurs.
Q2: Should I close my position if the MACD histogram starts shrinking?Not necessarily. Shrinking histogram bars alone aren’t sufficient reason to exit a trade unless you have predefined rules linking your strategy to such behavior. It’s better to assess the broader context, including price structure, volume, and other indicators, before making a decision.
Q3: How reliable is the MACD histogram in volatile crypto markets?The reliability of the MACD histogram varies depending on market conditions. In highly volatile environments, the histogram can produce erratic readings due to rapid price swings. Therefore, it’s best used alongside other tools that can filter out noise and highlight meaningful trends.
Q4: What timeframes work best with MACD histogram analysis?The effectiveness of the MACD histogram depends on the trader’s strategy and goals. Short-term traders may prefer 1-hour or 4-hour charts, where histogram changes can offer timely signals. Long-term investors often rely on daily or weekly charts to capture broader momentum shifts.
Disclaimer:info@kdj.com
The information provided is not trading advice. kdj.com does not assume any responsibility for any investments made based on the information provided in this article. Cryptocurrencies are highly volatile and it is highly recommended that you invest with caution after thorough research!
If you believe that the content used on this website infringes your copyright, please contact us immediately (info@kdj.com) and we will delete it promptly.


- Bitcoin, eCash Fork, and Airdrop Dynamics: A Deep Dive into Crypto's Latest Controversies
- 2026-05-03 12:55:01
- Consensus 2026 Miami: Web3, Blockchain, Cryptocurrency, NFTs, Metaverse, Conference, May 5th — Where Wall Street Meets the Digital Frontier
- 2026-05-02 12:45:01
- Fed Holds Rates Steady, Triggering Bitcoin Price Drop Amidst Geopolitical Tensions
- 2026-05-01 06:45:01
- Bitcoin Miners Electrify the Grid: Ohio Gas Plant Acquisition Powers Up a New Era for Digital Gold
- 2026-05-01 00:45:01
- MegaETH's MEGA Token Hits the Big Apple: Setting New Performance Benchmarks for Real-Time Blockchain
- 2026-05-01 00:55:01
- Solana's Slippery Slope: Price Prediction Points to Resistance Loss and Potential Further Drops
- 2026-05-01 06:45:01
Related knowledge

What Is Crypto Bottom Indicator? How Do Traders Identify Market Lows?
Jul 21,2026 at 08:20am
Bitcoin Halving Mechanics1. Bitcoin’s protocol enforces a fixed issuance schedule where block rewards are cut in half approximately every 210,000 bloc...

What Is Crypto Trend Reversal Indicator? Which Signals Should You Watch?
Jul 24,2026 at 11:00am
Market Volatility Patterns1. Bitcoin price swings often exceed 5% within a single 24-hour window during high-liquidity events such as ETF inflow annou...

What Is Weekly Bitcoin Chart Indicator? Can It Predict Long-Term Trends?
Jul 22,2026 at 07:39am
Market Volatility Patterns1. Price swings in cryptocurrency markets often exceed 10% within a 24-hour window, driven by liquidity constraints and algo...

What Is 4 Hour Chart Indicator? Why Do Crypto Traders Use It?
Jul 23,2026 at 02:20pm
Market Volatility Patterns1. Bitcoin price swings often exceed 10% within a 24-hour window during high-liquidity events such as ETF approval announcem...

What Is Premium Index Indicator? Why Does It Matter in Futures Trading?
Jul 23,2026 at 06:59pm
Premium Index Definition and Composition1. The Premium Index is a real-time metric derived from the weighted average price difference between perpetua...

What Is Basis Indicator in Crypto Futures? How Do Traders Use It?
Jul 20,2026 at 11:59pm
Basis Indicator Definition and Core Mechanics1. The basis indicator measures the price difference between a cryptocurrency’s spot price and its corres...
What Is Crypto Bottom Indicator? How Do Traders Identify Market Lows?
Jul 21,2026 at 08:20am
Bitcoin Halving Mechanics1. Bitcoin’s protocol enforces a fixed issuance schedule where block rewards are cut in half approximately every 210,000 bloc...
What Is Crypto Trend Reversal Indicator? Which Signals Should You Watch?
Jul 24,2026 at 11:00am
Market Volatility Patterns1. Bitcoin price swings often exceed 5% within a single 24-hour window during high-liquidity events such as ETF inflow annou...
What Is Weekly Bitcoin Chart Indicator? Can It Predict Long-Term Trends?
Jul 22,2026 at 07:39am
Market Volatility Patterns1. Price swings in cryptocurrency markets often exceed 10% within a 24-hour window, driven by liquidity constraints and algo...
What Is 4 Hour Chart Indicator? Why Do Crypto Traders Use It?
Jul 23,2026 at 02:20pm
Market Volatility Patterns1. Bitcoin price swings often exceed 10% within a 24-hour window during high-liquidity events such as ETF approval announcem...
What Is Premium Index Indicator? Why Does It Matter in Futures Trading?
Jul 23,2026 at 06:59pm
Premium Index Definition and Composition1. The Premium Index is a real-time metric derived from the weighted average price difference between perpetua...
What Is Basis Indicator in Crypto Futures? How Do Traders Use It?
Jul 20,2026 at 11:59pm
Basis Indicator Definition and Core Mechanics1. The basis indicator measures the price difference between a cryptocurrency’s spot price and its corres...
See all articles


