


![Xu Zhenzhen💞Wu Tianhao|He helps his neighbor casually on a rainy night. Who would have thought that he would be the dubbing master I have been chasing for many years? The male god was disabled in a car accident and suffered from low self-esteem and isolation. He was forced to pretend to be a couple to deal with the pressure to get married. I directly cured him and he finally stood up! [Sound caught in] #sweetpet #OverbearingPresident #Short drama #drama](/uploads/2026/06/18/cryptocurrencies-news/videos/origin_6a32ce38ba7ca_image_500_375.webp "Xu Zhenzhen💞Wu Tianhao|He helps his neighbor casually on a rainy night. Who would have thought that he would be the dubbing master I have been chasing for many years? The male god was disabled in a car accident and suffered from low self-esteem and isolation. He was forced to pretend to be a couple to deal with the pressure to get married. I directly cured him and he finally stood up! [Sound caught in] #sweetpet #OverbearingPresident #Short drama #drama")


-
 bitcoin
 $87959.907984 USD
1.34% - ethereum
$2920.497338 USD
3.04% - tether
$0.999775 USD
0.00% - xrp
$2.237324 USD
8.12% - bnb
$860.243768 USD
0.90% - solana
$138.089498 USD
5.43% - usd-coin
$0.999807 USD
0.01% - tron
$0.272801 USD
-1.53% - dogecoin
$0.150904 USD
2.96% - cardano
$0.421635 USD
1.97% - hyperliquid
$32.152445 USD
2.23% - bitcoin-cash
$533.301069 USD
-1.94% - chainlink
$12.953417 USD
2.68% - unus-sed-leo
$9.535951 USD
0.73% - zcash
$521.483386 USD
-2.87%


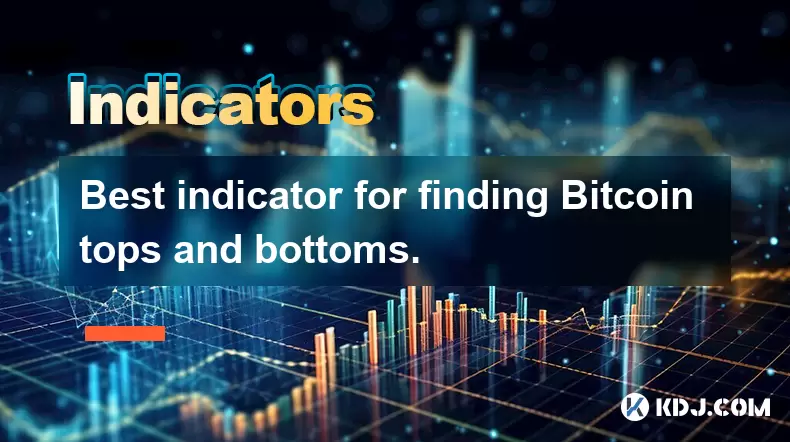
Best indicator for finding Bitcoin tops and bottoms.
Bitcoin traders use technical indicators like RSI, MACD, and Bollinger Bands to identify potential price reversals and improve trading decisions.
Jul 05, 2025 at 07:31 pm
Understanding Bitcoin Tops and Bottoms
Identifying Bitcoin tops and bottoms is a crucial skill for traders and investors aiming to maximize profits and minimize losses. These price points often signal potential reversals in the market trend, allowing participants to make informed decisions. However, no single indicator guarantees 100% accuracy due to the volatile and unpredictable nature of cryptocurrency markets.
To understand how to detect these turning points effectively, it’s essential to grasp what constitutes a top and a bottom. A top typically represents a peak where buying pressure diminishes, leading to a downward reversal. Conversely, a bottom occurs when selling pressure subsides, signaling an upward trend may begin. Recognizing these patterns helps traders time their entries and exits more precisely.
Key Indicators Used in Technical Analysis
Several technical indicators are widely used within the crypto community to identify potential tops and bottoms. Among them, the Relative Strength Index (RSI) stands out as one of the most popular tools. RSI measures the speed and change of price movements, indicating overbought or oversold conditions. When RSI exceeds 70, it suggests overbought levels, potentially signaling a top. Conversely, readings below 30 indicate oversold conditions, which could point to a bottom.
Another critical tool is the Moving Average Convergence Divergence (MACD). This indicator helps traders assess momentum and potential trend changes. A bearish crossover occurs when the MACD line crosses below the signal line, suggesting a possible top. On the flip side, a bullish crossover happens when the MACD line rises above the signal line, possibly indicating a bottom.
Additionally, Bollinger Bands offer insights into volatility and potential price extremes. Prices near the upper band may suggest overbought conditions, while those close to the lower band might indicate oversold levels. Observing how prices interact with these bands can help in identifying potential reversals.
Combining Indicators for Better Accuracy
While individual indicators provide valuable insights, combining multiple tools enhances accuracy. For instance, using both RSI and MACD together allows traders to confirm signals from each other. If RSI indicates overbought conditions while MACD shows a bearish crossover, this combination strengthens the case for a potential top.
Moreover, incorporating volume analysis can further validate potential tops and bottoms. High trading volumes during price movements often reinforce the significance of those moves. A rising price accompanied by increasing volume suggests strong buying interest, whereas declining prices with high volume may indicate panic selling.
Traders should also pay attention to chart patterns like head and shoulders or double tops/bottoms, which can serve as visual cues for impending reversals. Integrating these patterns with technical indicators creates a robust framework for analyzing Bitcoin's price action.
Practical Steps to Apply These Indicators
To apply these indicators effectively, traders must first choose a reliable trading platform that supports comprehensive technical analysis tools. Once access is secured, follow these steps:
- Select your preferred chart type—candlestick charts are commonly favored for their detailed representation of price action.
- Overlay the RSI indicator on the chart, adjusting settings if necessary; default settings usually work well for most users.
- Add the MACD indicator to analyze momentum alongside RSI.
- Incorporate Bollinger Bands to visualize volatility and potential price extremes.
After setting up the indicators, monitor their behavior in real-time. Look for instances where RSI reaches extreme levels while MACD confirms through crossovers. Observe how prices react around Bollinger Bands, noting any bounces or breakouts that could indicate potential tops or bottoms.
Common Pitfalls to Avoid
Despite the effectiveness of these indicators, several pitfalls can lead to misinterpretation. One common mistake is relying solely on one indicator without considering broader market context. Markets can remain irrational longer than anticipated, so always check for fundamental factors influencing Bitcoin’s price.
Another pitfall involves ignoring divergences between price action and indicator readings. For example, if Bitcoin makes a new high but RSI fails to reach previous highs, this divergence may hint at weakening momentum and an upcoming reversal.
Lastly, emotional trading based on fear or greed can cloud judgment. Stick to predefined strategies and risk management principles to avoid impulsive decisions that might result in significant losses.
Frequently Asked Questions
What timeframe is best for identifying Bitcoin tops and bottoms?The optimal timeframe depends on your trading style. Short-term traders might prefer 1-hour or 4-hour charts for quicker trades, while long-term investors may focus on daily or weekly charts for broader trends.
Can I rely solely on RSI for trading decisions?While RSI is powerful, it should not be used in isolation. Combining it with other indicators like MACD or volume analysis provides a more comprehensive view of the market dynamics.
How do I handle false signals from technical indicators?False signals are inevitable in trading. To mitigate their impact, use confirmation techniques such as waiting for candlestick closures beyond key levels or checking for confluence across different indicators before making trades.
Is there a specific strategy for exiting trades once a top or bottom is identified?Yes, setting stop-loss orders and take-profit targets can help manage risk and secure gains. Traders often place stop-loss orders just below recent swing lows for long positions or above swing highs for short positions, ensuring they protect against unexpected reversals.
Disclaimer:info@kdj.com
The information provided is not trading advice. kdj.com does not assume any responsibility for any investments made based on the information provided in this article. Cryptocurrencies are highly volatile and it is highly recommended that you invest with caution after thorough research!
If you believe that the content used on this website infringes your copyright, please contact us immediately (info@kdj.com) and we will delete it promptly.


- Bitcoin, eCash Fork, and Airdrop Dynamics: A Deep Dive into Crypto's Latest Controversies
- 2026-05-03 12:55:01
- Consensus 2026 Miami: Web3, Blockchain, Cryptocurrency, NFTs, Metaverse, Conference, May 5th — Where Wall Street Meets the Digital Frontier
- 2026-05-02 12:45:01
- Fed Holds Rates Steady, Triggering Bitcoin Price Drop Amidst Geopolitical Tensions
- 2026-05-01 06:45:01
- Bitcoin Miners Electrify the Grid: Ohio Gas Plant Acquisition Powers Up a New Era for Digital Gold
- 2026-05-01 00:45:01
- MegaETH's MEGA Token Hits the Big Apple: Setting New Performance Benchmarks for Real-Time Blockchain
- 2026-05-01 00:55:01
- Solana's Slippery Slope: Price Prediction Points to Resistance Loss and Potential Further Drops
- 2026-05-01 06:45:01
Related knowledge

What Are the Most Popular Crypto Indicators in 2026? Which Ones Still Work?
Jun 15,2026 at 04:40pm
RSI: The Enduring Momentum Gauge1. RSI remains one of the most widely adopted indicators across all timeframes, from scalping to position trading. 2. ...

What Is the Aroon Indicator? Can It Help Predict New Trends?
Jun 13,2026 at 01:37am
Market Volatility Patterns1. Bitcoin price swings often exceed 5% within a single trading session during high-liquidity events such as ETF inflow anno...

How to Confirm Trend Reversals Before Entering a Trade?
Jun 12,2026 at 02:39pm
Market Volatility Patterns1. Bitcoin’s price movements often reflect macroeconomic signals such as Federal Reserve interest rate decisions and inflati...

What Is a Volume Spike? Does It Signal a Major Price Move?
Jun 14,2026 at 03:20pm
Understanding Volume Spikes in Cryptocurrency Markets1. A volume spike refers to a sudden and substantial increase in the number of tokens traded with...

How to Use K-Line Indicators During High Volatility Events?
Jun 13,2026 at 11:21pm
K-Line Structure Recognition in Extreme Market Conditions1. A single K-line during high volatility often exhibits abnormally long wicks, indicating ra...

What Is the Best Indicator Combination for Bitcoin Trading?
Jun 13,2026 at 08:20am
BTC.D and Market Phase Recognition1. BTC.D reflects the proportional weight of Bitcoin’s market capitalization against the aggregate crypto market cap...
What Are the Most Popular Crypto Indicators in 2026? Which Ones Still Work?
Jun 15,2026 at 04:40pm
RSI: The Enduring Momentum Gauge1. RSI remains one of the most widely adopted indicators across all timeframes, from scalping to position trading. 2. ...
What Is the Aroon Indicator? Can It Help Predict New Trends?
Jun 13,2026 at 01:37am
Market Volatility Patterns1. Bitcoin price swings often exceed 5% within a single trading session during high-liquidity events such as ETF inflow anno...
How to Confirm Trend Reversals Before Entering a Trade?
Jun 12,2026 at 02:39pm
Market Volatility Patterns1. Bitcoin’s price movements often reflect macroeconomic signals such as Federal Reserve interest rate decisions and inflati...
What Is a Volume Spike? Does It Signal a Major Price Move?
Jun 14,2026 at 03:20pm
Understanding Volume Spikes in Cryptocurrency Markets1. A volume spike refers to a sudden and substantial increase in the number of tokens traded with...
How to Use K-Line Indicators During High Volatility Events?
Jun 13,2026 at 11:21pm
K-Line Structure Recognition in Extreme Market Conditions1. A single K-line during high volatility often exhibits abnormally long wicks, indicating ra...
What Is the Best Indicator Combination for Bitcoin Trading?
Jun 13,2026 at 08:20am
BTC.D and Market Phase Recognition1. BTC.D reflects the proportional weight of Bitcoin’s market capitalization against the aggregate crypto market cap...
See all articles


