


![Xu Zhenzhen💞Wu Tianhao|He helps his neighbor casually on a rainy night. Who would have thought that he would be the dubbing master I have been chasing for many years? The male god was disabled in a car accident and suffered from low self-esteem and isolation. He was forced to pretend to be a couple to deal with the pressure to get married. I directly cured him and he finally stood up! [Sound caught in] #sweetpet #OverbearingPresident #Short drama #drama](/uploads/2026/06/18/cryptocurrencies-news/videos/origin_6a32ce38ba7ca_image_500_375.webp "Xu Zhenzhen💞Wu Tianhao|He helps his neighbor casually on a rainy night. Who would have thought that he would be the dubbing master I have been chasing for many years? The male god was disabled in a car accident and suffered from low self-esteem and isolation. He was forced to pretend to be a couple to deal with the pressure to get married. I directly cured him and he finally stood up! [Sound caught in] #sweetpet #OverbearingPresident #Short drama #drama")


-
 bitcoin
 $87959.907984 USD
1.34% - ethereum
$2920.497338 USD
3.04% - tether
$0.999775 USD
0.00% - xrp
$2.237324 USD
8.12% - bnb
$860.243768 USD
0.90% - solana
$138.089498 USD
5.43% - usd-coin
$0.999807 USD
0.01% - tron
$0.272801 USD
-1.53% - dogecoin
$0.150904 USD
2.96% - cardano
$0.421635 USD
1.97% - hyperliquid
$32.152445 USD
2.23% - bitcoin-cash
$533.301069 USD
-1.94% - chainlink
$12.953417 USD
2.68% - unus-sed-leo
$9.535951 USD
0.73% - zcash
$521.483386 USD
-2.87%


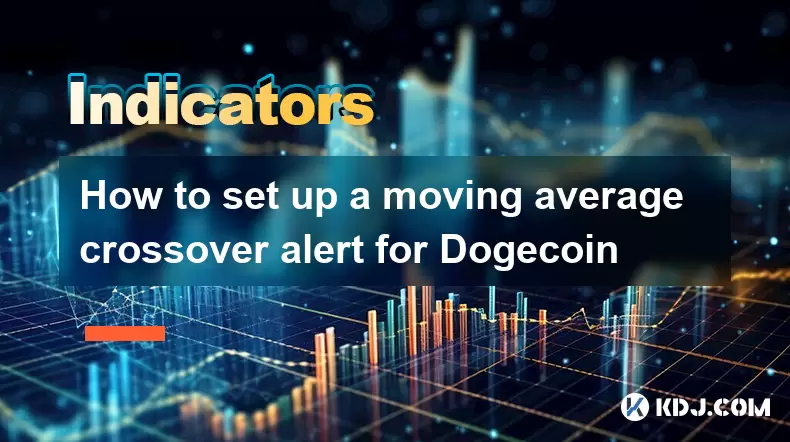
How to set up a moving average crossover alert for Dogecoin
Set up Dogecoin moving average crossover alerts on TradingView to track bullish or bearish trends and receive timely notifications via email, SMS, or app.
Jul 05, 2025 at 07:33 pm
Understanding Moving Averages and Their Relevance to Dogecoin
Moving averages (MAs) are among the most commonly used technical indicators in cryptocurrency trading. They help smooth out price data over a specific time period, offering traders a clearer view of trends. Dogecoin, being a highly volatile altcoin, often exhibits strong momentum when certain moving average crossovers occur.
The crossover strategy involves two MAs: a shorter-term average (e.g., 9-day) and a longer-term average (e.g., 21-day). When the shorter MA crosses above the longer MA, it signals a potential bullish trend. Conversely, a cross below suggests bearish momentum. This is particularly useful for traders looking to enter or exit positions based on trend shifts rather than arbitrary price levels.
Selecting the Right Platform for Setting Up Alerts
To set up a moving average crossover alert for Dogecoin, you’ll need a platform that supports custom alerts and technical indicators. TradingView is the most popular choice due to its robust customization options and user-friendly interface.
- Ensure you have an active account on TradingView.
- Navigate to the Dogecoin/USDT or Dogecoin/BTC chart depending on your preferred trading pair.
- Confirm that the chart displays real-time data and historical candlesticks accurately.
Adding Moving Averages to Your Chart
Once you're on the Dogecoin chart:
- Click on the “Indicators” button at the bottom of the screen.
- Search for “Moving Average” and add two instances to your chart.
- Configure one as a short-term MA (e.g., 9-period, close price, exponential).
- Set the second as a long-term MA (e.g., 21-period, close price, exponential).
Exponential Moving Averages (EMAs) are generally preferred over Simple Moving Averages (SMAs) because they give more weight to recent prices, which is crucial in fast-moving markets like Dogecoin.
You can adjust the colors and line styles of each MA to make visual identification easier during live monitoring.
Creating the Crossover Alert Condition
Now that both MAs are on your chart, it's time to create the actual alert condition:
Go to the “Alerts” tab located near the top-right corner of the TradingView interface.
Select “Create Alert.”
Under the “Condition” section, choose “Custom formula.”
Enter the following formula for a bullish crossover:
ta.crossover(ema(close, 9), ema(close, 21))For a bearish crossover, use:
ta.crossunder(ema(close, 9), ema(close, 21))
You can also set up multiple alerts with different timeframes or combinations of EMAs (e.g., 50 and 200 for long-term tracking).
Configuring Notification Settings for Immediate Updates
After setting the alert condition, configure how you want to receive notifications:
- Choose email, SMS, or webhook integration (for apps like Telegram or Discord).
- Enable pop-up alerts within the TradingView app if you’re actively watching the chart.
- Set frequency to “Once per bar” to avoid spamming yourself during volatile periods where multiple crossovers may happen closely.
Ensure your notification method is reliable and timely, especially since Dogecoin can move quickly once momentum builds. If using webhooks, verify the connection by sending a test message.
Also, consider setting up separate alerts for both bullish and bearish crossovers so you’re always aware of directional changes.
Verifying and Testing the Alert System
Before relying solely on the alert, perform a few checks:
- Switch to a lower timeframe (e.g., 1-hour chart) and observe whether the alert triggers as expected.
- Use historical mode to simulate past conditions and ensure the alert behaves consistently.
- Manually compare the alert trigger points with visual confirmation on the chart.
If any discrepancies arise, revisit the formula and settings to fine-tune the logic behind the alert.
Frequently Asked Questions
Can I set up moving average crossover alerts on mobile devices?Yes, TradingView has a mobile app that supports all alert features available on the desktop version. You can receive push notifications directly on your smartphone when a crossover occurs.
What other indicators work well alongside moving average crossovers for Dogecoin?Volume and RSI (Relative Strength Index) are commonly paired with moving averages. Volume confirms the strength of a crossover signal, while RSI helps identify overbought or oversold conditions.
Is it possible to automate trades based on these alerts?Yes, through third-party bots like 3Commas or TradeSanta, you can link your exchange account and execute trades automatically when a TradingView alert is triggered via webhook.
Do I need to pay for TradingView to create these alerts?No, basic alerts are available on the free plan. However, advanced users might benefit from a TradingView Pro plan, which allows for more complex strategies and additional indicators.
Disclaimer:info@kdj.com
The information provided is not trading advice. kdj.com does not assume any responsibility for any investments made based on the information provided in this article. Cryptocurrencies are highly volatile and it is highly recommended that you invest with caution after thorough research!
If you believe that the content used on this website infringes your copyright, please contact us immediately (info@kdj.com) and we will delete it promptly.


- Bitcoin, eCash Fork, and Airdrop Dynamics: A Deep Dive into Crypto's Latest Controversies
- 2026-05-03 12:55:01
- Consensus 2026 Miami: Web3, Blockchain, Cryptocurrency, NFTs, Metaverse, Conference, May 5th — Where Wall Street Meets the Digital Frontier
- 2026-05-02 12:45:01
- Fed Holds Rates Steady, Triggering Bitcoin Price Drop Amidst Geopolitical Tensions
- 2026-05-01 06:45:01
- Bitcoin Miners Electrify the Grid: Ohio Gas Plant Acquisition Powers Up a New Era for Digital Gold
- 2026-05-01 00:45:01
- MegaETH's MEGA Token Hits the Big Apple: Setting New Performance Benchmarks for Real-Time Blockchain
- 2026-05-01 00:55:01
- Solana's Slippery Slope: Price Prediction Points to Resistance Loss and Potential Further Drops
- 2026-05-01 06:45:01
Related knowledge

What Are the Most Popular Crypto Indicators in 2026? Which Ones Still Work?
Jun 15,2026 at 04:40pm
RSI: The Enduring Momentum Gauge1. RSI remains one of the most widely adopted indicators across all timeframes, from scalping to position trading. 2. ...

What Is the Aroon Indicator? Can It Help Predict New Trends?
Jun 13,2026 at 01:37am
Market Volatility Patterns1. Bitcoin price swings often exceed 5% within a single trading session during high-liquidity events such as ETF inflow anno...

How to Confirm Trend Reversals Before Entering a Trade?
Jun 12,2026 at 02:39pm
Market Volatility Patterns1. Bitcoin’s price movements often reflect macroeconomic signals such as Federal Reserve interest rate decisions and inflati...

What Is a Volume Spike? Does It Signal a Major Price Move?
Jun 14,2026 at 03:20pm
Understanding Volume Spikes in Cryptocurrency Markets1. A volume spike refers to a sudden and substantial increase in the number of tokens traded with...

How to Use K-Line Indicators During High Volatility Events?
Jun 13,2026 at 11:21pm
K-Line Structure Recognition in Extreme Market Conditions1. A single K-line during high volatility often exhibits abnormally long wicks, indicating ra...

What Is the Best Indicator Combination for Bitcoin Trading?
Jun 13,2026 at 08:20am
BTC.D and Market Phase Recognition1. BTC.D reflects the proportional weight of Bitcoin’s market capitalization against the aggregate crypto market cap...
What Are the Most Popular Crypto Indicators in 2026? Which Ones Still Work?
Jun 15,2026 at 04:40pm
RSI: The Enduring Momentum Gauge1. RSI remains one of the most widely adopted indicators across all timeframes, from scalping to position trading. 2. ...
What Is the Aroon Indicator? Can It Help Predict New Trends?
Jun 13,2026 at 01:37am
Market Volatility Patterns1. Bitcoin price swings often exceed 5% within a single trading session during high-liquidity events such as ETF inflow anno...
How to Confirm Trend Reversals Before Entering a Trade?
Jun 12,2026 at 02:39pm
Market Volatility Patterns1. Bitcoin’s price movements often reflect macroeconomic signals such as Federal Reserve interest rate decisions and inflati...
What Is a Volume Spike? Does It Signal a Major Price Move?
Jun 14,2026 at 03:20pm
Understanding Volume Spikes in Cryptocurrency Markets1. A volume spike refers to a sudden and substantial increase in the number of tokens traded with...
How to Use K-Line Indicators During High Volatility Events?
Jun 13,2026 at 11:21pm
K-Line Structure Recognition in Extreme Market Conditions1. A single K-line during high volatility often exhibits abnormally long wicks, indicating ra...
What Is the Best Indicator Combination for Bitcoin Trading?
Jun 13,2026 at 08:20am
BTC.D and Market Phase Recognition1. BTC.D reflects the proportional weight of Bitcoin’s market capitalization against the aggregate crypto market cap...
See all articles


