


![[Updated Season 5] Watch Seasons 1-5 in one go🔥Starting with a mortal body and useless roots, he was despised by the whole family! His hard core awakens the mysterious black tank and starts the replication of all things | MULTI SUB](/uploads/2026/07/02/cryptocurrencies-news/videos/origin_6a45e757ec145_image_500_375.webp "[Updated Season 5] Watch Seasons 1-5 in one go🔥Starting with a mortal body and useless roots, he was despised by the whole family! His hard core awakens the mysterious black tank and starts the replication of all things | MULTI SUB")


-
 bitcoin
 $87959.907984 USD
1.34% - ethereum
$2920.497338 USD
3.04% - tether
$0.999775 USD
0.00% - xrp
$2.237324 USD
8.12% - bnb
$860.243768 USD
0.90% - solana
$138.089498 USD
5.43% - usd-coin
$0.999807 USD
0.01% - tron
$0.272801 USD
-1.53% - dogecoin
$0.150904 USD
2.96% - cardano
$0.421635 USD
1.97% - hyperliquid
$32.152445 USD
2.23% - bitcoin-cash
$533.301069 USD
-1.94% - chainlink
$12.953417 USD
2.68% - unus-sed-leo
$9.535951 USD
0.73% - zcash
$521.483386 USD
-2.87%


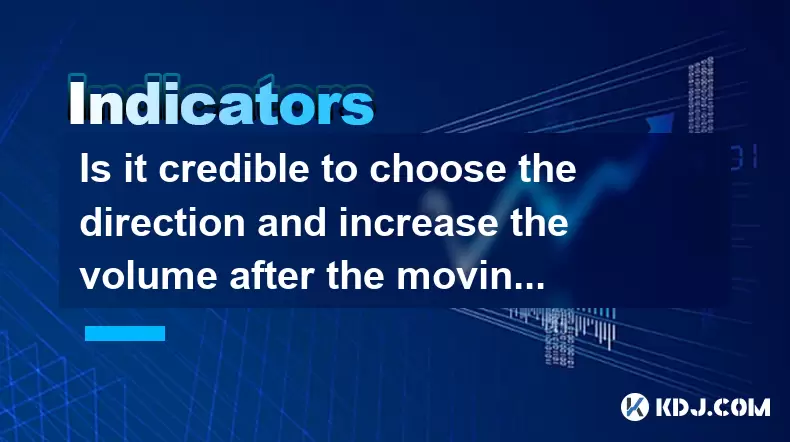
Is it credible to choose the direction and increase the volume after the moving average is glued together?
When moving averages converge and volume spikes, it may signal a potential breakout in crypto markets, but confirmation with other indicators is crucial.
Jul 01, 2025 at 09:28 pm
Understanding the Concept of Moving Average Glue
In technical analysis, moving averages are commonly used tools to identify trends in price movements. When two or more moving averages (such as the 50-day and 200-day) converge or appear to be 'glued' together, this often signals a period of consolidation or indecision in the market. This phenomenon is sometimes interpreted by traders as a potential precursor to a breakout in either direction — bullish or bearish.
The idea behind using the 'glued moving average' strategy is that once the price breaks out from this tight range, volume can act as a confirmation signal. If the breakout is accompanied by a surge in volume, it may indicate strong participation and validate the new trend direction. However, the credibility of such an approach requires deeper scrutiny, especially within the volatile world of cryptocurrencies.
Note:In crypto markets, due to their high volatility and liquidity variations, interpreting glued moving averages must be done with caution and supported by additional indicators.
How Moving Averages Interact During Low Volatility Periods
During periods of low volatility, moving averages tend to compress toward each other. This compression is visually evident when charted and is often referred to as 'glued' or 'converged' moving averages. It typically occurs after extended sideways movement or following a prolonged downtrend or uptrend where momentum has diminished.
In cryptocurrency trading, such patterns are frequently observed on timeframes ranging from 1-hour charts to daily charts. Traders often watch for signs of increased volume during or immediately after this convergence phase, believing that it could hint at the next directional move.
- Volume spikes may suggest that institutional or large retail players are entering the market.
- Price action around these levels can help determine whether the breakout is genuine or a false signal.
- Support and resistance levels near glued moving averages should also be considered for better context.
However, relying solely on this pattern without confirming tools like RSI, MACD, or Fibonacci retracement levels can lead to misleading conclusions.
Why Volume Matters After Moving Averages Converge
Volume plays a critical role in validating breakouts after moving averages have converged. A sudden increase in volume can be interpreted as a sign of conviction among traders. In the context of cryptocurrencies, which often experience sharp moves based on news, social sentiment, or macroeconomic factors, volume becomes even more crucial.
Here’s how to interpret volume changes:
- Rising volume during a breakout suggests that buyers (or sellers) are aggressively entering the market, increasing the probability that the move is sustainable.
- Low or declining volume during a breakout may indicate lack of interest and potentially signal a fakeout or false breakout.
- Historical volume comparisons can help assess whether the current volume is abnormal or within normal ranges.
It's essential to use volume indicators like On-Balance Volume (OBV) or Chaikin Money Flow (CMF) to get a clearer picture of capital inflows and outflows.
Step-by-Step Guide to Applying This Strategy in Crypto Trading
To implement the glued moving average plus volume strategy effectively in cryptocurrency trading, follow these steps:
- Select at least two moving averages — for example, the 50-period and 200-period exponential moving averages (EMA).
- Observe when the two EMAs come close together or overlap on the chart, indicating a consolidation phase.
- Monitor the price action closely during this period to detect any early signs of a breakout.
- Watch for a clear candlestick close above or below the moving average cluster to confirm the breakout direction.
- Simultaneously check for a significant increase in volume compared to the average volume over the past 10–20 candles.
- Place a stop-loss order just beyond the opposite side of the moving average cluster to manage risk.
- Use trailing stops or profit targets based on recent volatility or key support/resistance zones.
This method works best in trending markets but can produce mixed results in choppy or sideways conditions. Therefore, combining it with other forms of analysis is highly recommended.
Common Pitfalls and Misinterpretations
While the glued moving average and volume strategy might seem logical, several pitfalls can undermine its effectiveness, particularly in crypto markets:
- False breakouts are common in low-liquidity altcoins or during low-volume hours, leading to premature entries.
- Lack of timeframe consistency — what appears as a glued MA setup on a 4-hour chart may not align with the daily chart context.
- Overreliance on volume alone — volume surges can occur due to panic selling or short squeezes rather than sustainable trends.
- No consideration of fundamentals or external events — major news or regulatory updates can invalidate technical setups instantly.
Traders who fail to account for these nuances may end up making emotionally driven decisions instead of disciplined, rule-based trades.
Frequently Asked Questions
Q: Can I apply this strategy to all cryptocurrencies?A: While the glued moving average and volume strategy can be applied across various assets, its reliability varies depending on the liquidity and volatility of the specific cryptocurrency. Major coins like Bitcoin and Ethereum tend to provide more consistent signals compared to smaller-cap tokens.
Q: How long should I wait after the moving averages glue together before taking action?A: There’s no fixed waiting period, but most traders observe the price behavior over 3–5 candlesticks after the convergence. Patience is key to avoid premature entries.
Q: Should I always wait for a volume spike before entering a trade?A: Ideally, yes. A volume spike serves as confirmation that the breakout isn’t just noise. However, in some cases, especially during fast-moving bull runs, volume may lag slightly behind price.
Q: Are there alternative indicators that work well with glued moving averages?A: Yes, combining this strategy with tools like Bollinger Bands, Ichimoku Cloud, or Fibonacci extensions can improve accuracy. Additionally, oscillators like RSI or Stochastic can help filter out false signals.
Disclaimer:info@kdj.com
The information provided is not trading advice. kdj.com does not assume any responsibility for any investments made based on the information provided in this article. Cryptocurrencies are highly volatile and it is highly recommended that you invest with caution after thorough research!
If you believe that the content used on this website infringes your copyright, please contact us immediately (info@kdj.com) and we will delete it promptly.


- Bitcoin, eCash Fork, and Airdrop Dynamics: A Deep Dive into Crypto's Latest Controversies
- 2026-05-03 12:55:01
- Consensus 2026 Miami: Web3, Blockchain, Cryptocurrency, NFTs, Metaverse, Conference, May 5th — Where Wall Street Meets the Digital Frontier
- 2026-05-02 12:45:01
- Fed Holds Rates Steady, Triggering Bitcoin Price Drop Amidst Geopolitical Tensions
- 2026-05-01 06:45:01
- Bitcoin Miners Electrify the Grid: Ohio Gas Plant Acquisition Powers Up a New Era for Digital Gold
- 2026-05-01 00:45:01
- MegaETH's MEGA Token Hits the Big Apple: Setting New Performance Benchmarks for Real-Time Blockchain
- 2026-05-01 00:55:01
- Solana's Slippery Slope: Price Prediction Points to Resistance Loss and Potential Further Drops
- 2026-05-01 06:45:01
Related knowledge

How does RSI overextension signal potential crypto correction?
Jun 29,2026 at 04:39pm
RSI Overextension Mechanics in Crypto Markets1. RSI values above 70 indicate overbought conditions where buying pressure has exhausted itself across m...

What is stochastic RSI crossover strategy in crypto trading?
Jun 29,2026 at 02:00pm
Stochastic RSI Fundamentals in Cryptocurrency Markets1. Stochastic RSI is derived from the standard RSI but applies stochastic oscillator logic to its...

What does OBV spike reveal about crypto whale activity?
Jun 30,2026 at 01:19am
On-Balance Volume and Whale Accumulation Patterns1. A sharp OBV spike coincides with unusually large inflows into exchange wallets, often preceding su...

How does ATR spike indicate panic selling in crypto markets?
Jun 28,2026 at 03:39pm
ATR Spike as a Real-Time Panic Signal1. The Average True Range (ATR) measures volatility by calculating the average of true ranges over a defined peri...

How does SMA act as psychological level in crypto markets?
Jun 28,2026 at 06:19pm
Psychological Anchoring in Market Sentiment1. Social Media Addiction (SMA) manifests in crypto markets through persistent attention fixation on price ...

What is stochastic momentum index in crypto trading?
Jul 02,2026 at 01:40pm
Definition and Core Mechanics1. The Stochastic Momentum Index (SMI) is a refined oscillator derived from the classic Stochastic Oscillator, adapted fo...
How does RSI overextension signal potential crypto correction?
Jun 29,2026 at 04:39pm
RSI Overextension Mechanics in Crypto Markets1. RSI values above 70 indicate overbought conditions where buying pressure has exhausted itself across m...
What is stochastic RSI crossover strategy in crypto trading?
Jun 29,2026 at 02:00pm
Stochastic RSI Fundamentals in Cryptocurrency Markets1. Stochastic RSI is derived from the standard RSI but applies stochastic oscillator logic to its...
What does OBV spike reveal about crypto whale activity?
Jun 30,2026 at 01:19am
On-Balance Volume and Whale Accumulation Patterns1. A sharp OBV spike coincides with unusually large inflows into exchange wallets, often preceding su...
How does ATR spike indicate panic selling in crypto markets?
Jun 28,2026 at 03:39pm
ATR Spike as a Real-Time Panic Signal1. The Average True Range (ATR) measures volatility by calculating the average of true ranges over a defined peri...
How does SMA act as psychological level in crypto markets?
Jun 28,2026 at 06:19pm
Psychological Anchoring in Market Sentiment1. Social Media Addiction (SMA) manifests in crypto markets through persistent attention fixation on price ...
What is stochastic momentum index in crypto trading?
Jul 02,2026 at 01:40pm
Definition and Core Mechanics1. The Stochastic Momentum Index (SMI) is a refined oscillator derived from the classic Stochastic Oscillator, adapted fo...
See all articles


