-
 Bitcoin
 $106,754.6083
1.33% -
 Ethereum
 $2,625.8249
3.80% -
 Tether USDt
 $1.0001
-0.03% -
 XRP
XRP $2.1891
1.67% -
 BNB
BNB $654.5220
0.66% -
 Solana
 $156.9428
7.28% -
 USDC
USDC $0.9998
0.00% -
 Dogecoin
 $0.1780
1.14% -
 TRON
TRON $0.2706
-0.16% -
 Cardano
 $0.6470
2.77% -
 Hyperliquid
 $44.6467
10.24% -
 Sui
Sui $3.1128
3.86% -
 Bitcoin Cash
 $455.7646
3.00% -
 Chainlink
 $13.6858
4.08% -
 UNUS SED LEO
 $9.2682
0.21% -
 Avalanche
 $19.7433
3.79% -
 Stellar
 $0.2616
1.64% -
 Toncoin
 $3.0222
2.19% -
 Shiba Inu
 $0.0...01220
1.49% -
 Hedera
 $0.1580
2.75% -
 Litecoin
 $87.4964
2.29% -
 Polkadot
 $3.8958
3.05% -
 Ethena USDe
 $1.0000
-0.04% -
 Monero
 $317.2263
0.26% -
 Bitget Token
 $4.5985
1.68% -
 Dai
Dai $0.9999
0.00% -
 Pepe
Pepe $0.0...01140
2.44% -
 Uniswap
 $7.6065
5.29% -
 Pi
Pi $0.6042
-2.00% -
 Aave
Aave $289.6343
6.02%
Is the Bollinger Band middle track support effective? Can the signal credibility be enhanced by combining with the trading volume?
The Bollinger Band middle track can act as a dynamic support level in crypto trading, with signal credibility enhanced by high trading volume.
Jun 05, 2025 at 11:49 am
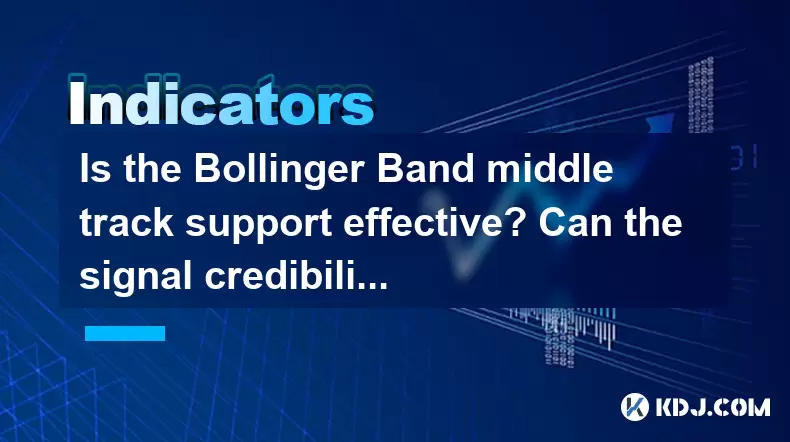
The effectiveness of the Bollinger Band middle track as a support level and the potential enhancement of signal credibility by combining it with trading volume are two important aspects that traders often consider in the cryptocurrency market. In this article, we will delve into these topics, providing a comprehensive analysis and detailed insights.
Understanding Bollinger Bands and Their Middle Track
Bollinger Bands are a popular technical analysis tool used by traders to gauge market volatility and potential price levels. They consist of three lines: the middle band, which is typically a simple moving average (SMA), and two outer bands that are standard deviations away from the middle band. The middle track of the Bollinger Bands is often considered a significant support or resistance level.
The middle track, usually a 20-period SMA, acts as the baseline for the Bollinger Bands. It represents the average price over the specified period and is used to identify potential support and resistance levels. When the price approaches the middle track, it can indicate a potential reversal or continuation of the current trend, depending on other market conditions.
Effectiveness of the Middle Track as Support
The effectiveness of the middle track as a support level can vary depending on the market conditions and the asset being traded. In the cryptocurrency market, where volatility is high, the middle track can serve as a dynamic support level. When the price touches or approaches the middle track, it often indicates that the price is reverting to the mean, which can be a sign of a potential bounce or a continuation of the trend.
To assess the effectiveness of the middle track as support, traders should consider the following factors:
- Market Trend: In a strong uptrend, the middle track can act as a solid support level, where the price may find a floor before resuming its upward movement. Conversely, in a downtrend, the middle track might not hold as effectively as a support level.
- Price Action: The behavior of the price when it approaches the middle track is crucial. If the price consistently bounces off the middle track, it suggests strong support. However, if the price breaks through the middle track and continues to decline, it indicates that the support level has been breached.
- Volatility: High volatility can lead to more frequent touches of the middle track, making it a more reliable support level in volatile markets like cryptocurrencies.
Combining Bollinger Bands with Trading Volume
Combining Bollinger Bands with trading volume can enhance the credibility of trading signals. Trading volume is a key indicator that reflects the strength of a price move. When the price touches the middle track and the trading volume is high, it can confirm the strength of the support or resistance level.
Here’s how traders can use trading volume to enhance the credibility of Bollinger Band signals:
- Volume Confirmation: When the price touches the middle track and the trading volume spikes, it suggests strong buying or selling pressure at that level. A high volume at the middle track can confirm that the support or resistance level is significant.
- Volume Divergence: If the price touches the middle track but the trading volume is low, it may indicate weak support or resistance. Traders should be cautious in such scenarios as the price might not hold at the middle track.
- Volume Trends: Observing the trend in trading volume over time can provide additional insights. Increasing volume as the price approaches the middle track can signal a potential reversal or continuation, while decreasing volume might suggest waning interest and a possible breakdown of the support level.
Practical Application: Using Bollinger Bands and Volume in Trading
To effectively use Bollinger Bands and trading volume in cryptocurrency trading, follow these steps:
- Set Up the Chart: Open your trading platform and set up a chart for the cryptocurrency you are interested in. Add the Bollinger Bands indicator with a 20-period SMA for the middle track.
- Monitor the Price: Watch the price as it approaches the middle track. Pay attention to how the price interacts with the middle track, whether it bounces off or breaks through.
- Analyze the Volume: Simultaneously, monitor the trading volume. Use a volume indicator on your chart to track the volume levels as the price touches the middle track.
- Confirm the Signal: If the price touches the middle track and the trading volume is high, consider it a strong signal. If the volume is low, be cautious and wait for further confirmation.
- Execute the Trade: Based on the confirmed signal, execute your trade. For example, if the price bounces off the middle track with high volume, consider entering a long position. If the price breaks through the middle track with high volume, consider entering a short position.
Case Studies: Real-World Examples
To illustrate the effectiveness of the middle track as support and the enhancement of signal credibility through volume, let’s look at a few case studies from the cryptocurrency market.
Case Study 1: Bitcoin (BTC)
In a recent trading session, Bitcoin approached the middle track of the Bollinger Bands. The price touched the middle track, and the trading volume spiked significantly. This high volume confirmed strong buying interest at the middle track, and the price subsequently bounced off the level, resuming its uptrend. Traders who entered long positions at the middle track with the volume confirmation would have benefited from the subsequent price increase.
Case Study 2: Ethereum (ETH)
In another example, Ethereum’s price approached the middle track of the Bollinger Bands during a downtrend. The price touched the middle track, but the trading volume was relatively low. This low volume indicated weak support, and the price eventually broke through the middle track, continuing its downward movement. Traders who relied solely on the middle track without considering the volume would have been caught in a false signal.
Case Study 3: Ripple (XRP)
In a volatile trading session, Ripple’s price frequently touched the middle track of the Bollinger Bands. Each time the price approached the middle track, the trading volume was high, confirming strong support. The price consistently bounced off the middle track, indicating a reliable support level in a volatile market. Traders who used both the Bollinger Bands and volume indicators were able to capitalize on these bounces.
Frequently Asked Questions
Q1: Can the Bollinger Band middle track be used as a resistance level as well?
Yes, the Bollinger Band middle track can serve as both a support and a resistance level. In an uptrend, the middle track can act as a resistance level where the price might find a ceiling before continuing its upward movement. Traders should monitor the price action and trading volume to confirm the strength of the resistance level.
Q2: How can traders differentiate between a false signal and a true signal when using Bollinger Bands and volume?
To differentiate between false and true signals, traders should look for consistency in the price action and volume. A true signal is often accompanied by high trading volume and consistent price behavior, such as multiple bounces off the middle track. A false signal may show low volume and inconsistent price action, indicating weak support or resistance.
Q3: Are there other technical indicators that can be used in conjunction with Bollinger Bands and volume to enhance trading signals?
Yes, other technical indicators can be used in conjunction with Bollinger Bands and volume to enhance trading signals. Some popular indicators include the Relative Strength Index (RSI), Moving Average Convergence Divergence (MACD), and the Stochastic Oscillator. These indicators can provide additional confirmation and help traders make more informed decisions.
Q4: How should traders adjust their strategies based on different timeframes when using Bollinger Bands and volume?
Traders should adjust their strategies based on different timeframes by considering the sensitivity of the Bollinger Bands and the significance of the trading volume. On shorter timeframes, such as 15-minute or 1-hour charts, the Bollinger Bands may be more sensitive to price movements, and volume spikes can be more frequent. On longer timeframes, such as daily or weekly charts, the Bollinger Bands may be less sensitive, and volume spikes can indicate more significant market moves. Traders should adapt their entry and exit points accordingly.
Disclaimer:info@kdj.com
The information provided is not trading advice. kdj.com does not assume any responsibility for any investments made based on the information provided in this article. Cryptocurrencies are highly volatile and it is highly recommended that you invest with caution after thorough research!
If you believe that the content used on this website infringes your copyright, please contact us immediately (info@kdj.com) and we will delete it promptly.
- Web3 Idol Audition: WIPA Revolutionizes Popularity Ceremonies
- 2025-06-18 20:25:13
- CoinGecko's Anti-Rug Pull Tool: A Shield Against NFT Scams
- 2025-06-18 20:25:13
- XRP, Prediction Markets, and MRT Token: A New Era for XRPL?
- 2025-06-18 20:45:12
- Bitcoin, NASDAQ, and the Iran-Israel Conflict: A Risky Tango
- 2025-06-18 20:45:12
- Bitcoin, Oil Shock, and Inflation: Navigating the Perfect Storm
- 2025-06-18 21:05:12
- Hit the Jackpot: Your Guide to Crypto Casinos and Big Payouts in 2025
- 2025-06-18 21:25:13
Related knowledge
Why does the contract sometimes not fall after the moving average crosses?
Jun 18,2025 at 08:50pm
Understanding Moving Averages in Cryptocurrency TradingIn the realm of cryptocurrency trading, moving averages are among the most widely used technical indicators. They help traders identify potential trends by smoothing out price data over a specified period. The two primary types are the Simple Moving Average (SMA) and the Exponential Moving Average (...

How to predict the acceleration of contract market by the change of moving average slope?
Jun 18,2025 at 05:43pm
Understanding the Moving Average in Cryptocurrency TradingIn cryptocurrency trading, moving average (MA) is a fundamental technical indicator used to analyze price trends. It smooths out price data over a specific period, helping traders identify potential trend directions and momentum shifts. The slope of a moving average line reflects how quickly pric...
How to capture the starting point of contract by K-line pattern and volume?
Jun 18,2025 at 06:07pm
Understanding the Basics of K-Line PatternsK-line patterns are essential tools for technical analysis in the cryptocurrency market. These patterns, derived from Japanese candlestick charts, provide insights into potential price movements based on historical data. Each K-line represents a specific time period and displays the open, high, low, and close p...
How to interpret the low opening the next day after the long lower shadow hits the bottom?
Jun 18,2025 at 12:22am
Understanding the Long Lower Shadow Candlestick PatternIn technical analysis, a long lower shadow candlestick is often seen as a potential reversal signal in a downtrend. This pattern occurs when the price opens, trades significantly lower during the session, but then recovers to close near the opening price or slightly above. The long wick at the botto...
How to operate the RSI indicator repeatedly in the 40-60 range?
Jun 18,2025 at 12:56am
Understanding the RSI Indicator and Its RelevanceThe Relative Strength Index (RSI) is a momentum oscillator widely used in cryptocurrency trading to measure the speed and change of price movements. Typically, the RSI ranges from 0 to 100, with levels above 70 considered overbought and below 30 considered oversold. However, when the RSI repeatedly stays ...
Why is the volume ratio suddenly enlarged three times but the price fluctuation is small?
Jun 18,2025 at 04:42am
Understanding the Relationship Between Trading Volume and Price MovementIn the world of cryptocurrency trading, volume is a crucial metric that reflects the number of assets traded within a specific time frame. It often serves as an indicator of market interest and liquidity. However, there are instances where trading volume surges dramatically—sometime...

Why does the contract sometimes not fall after the moving average crosses?
Jun 18,2025 at 08:50pm
Understanding Moving Averages in Cryptocurrency TradingIn the realm of cryptocurrency trading, moving averages are among the most widely used technical indicators. They help traders identify potential trends by smoothing out price data over a specified period. The two primary types are the Simple Moving Average (SMA) and the Exponential Moving Average (...

How to predict the acceleration of contract market by the change of moving average slope?
Jun 18,2025 at 05:43pm
Understanding the Moving Average in Cryptocurrency TradingIn cryptocurrency trading, moving average (MA) is a fundamental technical indicator used to analyze price trends. It smooths out price data over a specific period, helping traders identify potential trend directions and momentum shifts. The slope of a moving average line reflects how quickly pric...

How to capture the starting point of contract by K-line pattern and volume?
Jun 18,2025 at 06:07pm
Understanding the Basics of K-Line PatternsK-line patterns are essential tools for technical analysis in the cryptocurrency market. These patterns, derived from Japanese candlestick charts, provide insights into potential price movements based on historical data. Each K-line represents a specific time period and displays the open, high, low, and close p...

How to interpret the low opening the next day after the long lower shadow hits the bottom?
Jun 18,2025 at 12:22am
Understanding the Long Lower Shadow Candlestick PatternIn technical analysis, a long lower shadow candlestick is often seen as a potential reversal signal in a downtrend. This pattern occurs when the price opens, trades significantly lower during the session, but then recovers to close near the opening price or slightly above. The long wick at the botto...

How to operate the RSI indicator repeatedly in the 40-60 range?
Jun 18,2025 at 12:56am
Understanding the RSI Indicator and Its RelevanceThe Relative Strength Index (RSI) is a momentum oscillator widely used in cryptocurrency trading to measure the speed and change of price movements. Typically, the RSI ranges from 0 to 100, with levels above 70 considered overbought and below 30 considered oversold. However, when the RSI repeatedly stays ...

Why is the volume ratio suddenly enlarged three times but the price fluctuation is small?
Jun 18,2025 at 04:42am
Understanding the Relationship Between Trading Volume and Price MovementIn the world of cryptocurrency trading, volume is a crucial metric that reflects the number of assets traded within a specific time frame. It often serves as an indicator of market interest and liquidity. However, there are instances where trading volume surges dramatically—sometime...
See all articles


