


-
 bitcoin
 $87959.907984 USD
1.34% - ethereum
$2920.497338 USD
3.04% - tether
$0.999775 USD
0.00% - xrp
$2.237324 USD
8.12% - bnb
$860.243768 USD
0.90% - solana
$138.089498 USD
5.43% - usd-coin
$0.999807 USD
0.01% - tron
$0.272801 USD
-1.53% - dogecoin
$0.150904 USD
2.96% - cardano
$0.421635 USD
1.97% - hyperliquid
$32.152445 USD
2.23% - bitcoin-cash
$533.301069 USD
-1.94% - chainlink
$12.953417 USD
2.68% - unus-sed-leo
$9.535951 USD
0.73% - zcash
$521.483386 USD
-2.87%


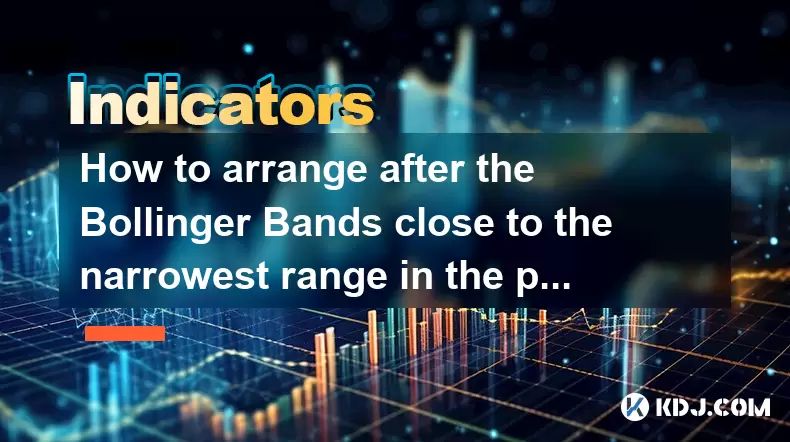
How to arrange after the Bollinger Bands close to the narrowest range in the past six months?
When Bollinger Bands contract to their narrowest in six months, it signals low volatility and often precedes a significant price breakout in cryptocurrencies like Bitcoin or Ethereum.
Jun 29, 2025 at 06:21 am
Understanding Bollinger Bands and Their Behavior
Bollinger Bands are a widely used technical analysis tool in the cryptocurrency trading community. They consist of a 20-period moving average with two standard deviation bands plotted above and below it. These bands dynamically adjust to price volatility, expanding during periods of high volatility and contracting when volatility decreases. When the bands contract to their narrowest range in six months, this often signals a potential breakout or sharp price movement.
Traders must understand that this contraction indicates low volatility, which historically precedes significant market moves. In the context of cryptocurrencies like Bitcoin or Ethereum, where price swings are common, identifying these moments can offer strategic entry or exit points.
Identifying the Narrowest Range Scenario
To determine whether the current Bollinger Band width is at its narrowest point in the last six months, traders need to calculate the band width as a percentage of the middle band (the 20-day simple moving average). This involves:
- Fetching historical price data for the past six months.
- Calculating the upper and lower bands for each day using the standard formula:
Upper Band = SMA + (2 × Standard Deviation)Lower Band = SMA - (2 × Standard Deviation) - Measuring the difference between the upper and lower bands for each period.
- Expressing this difference as a percentage of the SMA to normalize across different price levels.
- Comparing today’s band width with the previous 180 days’ values to confirm if it's indeed the narrowest.
Once confirmed, traders should prepare for a potential volatility expansion, which could manifest as a strong trend continuation or reversal depending on other market factors.
Evaluating Market Context Before Acting
Before making any decisions based solely on Bollinger Band compression, it's essential to evaluate the broader market environment. Cryptocurrency markets are highly sensitive to news, macroeconomic data, and regulatory changes. A narrowing Bollinger Band may coincide with a major event such as:
- A Federal Reserve interest rate decision
- A significant regulatory announcement
- A major exchange listing or delisting
- A known whale transaction or large-scale on-chain movement
These external catalysts can heavily influence how the price reacts once the band breaks. Ignoring them might lead to premature entries or misjudged exits. Therefore, cross-referencing with news feeds, on-chain analytics, and volume patterns becomes crucial.
Trading Strategies During Bollinger Band Contraction
When Bollinger Bands reach their narrowest in six months, several strategies can be applied depending on the trader's risk appetite and time horizon.
One popular approach is the breakout strategy, where traders place orders just beyond the upper or lower bands. The idea is that once the price breaches one of these boundaries, a strong move follows in that direction.
Another method is the mean reversion strategy, which assumes that after a long period of low volatility, the price will remain range-bound. Traders using this approach may look to buy near the lower band and sell near the upper band within the compressed range.
For more advanced users, combining Bollinger Bands with volume indicators like OBV (On-Balance Volume) or momentum oscillators like RSI or MACD can provide confirmation signals before entering a trade.
Here are some steps traders can follow:
- Monitor the band width percentage daily.
- Set up alerts when the band width hits a new six-month minimum.
- Use candlestick patterns to gauge possible reversal or continuation signals.
- Wait for a convincing close outside the band before entering a breakout trade.
- Consider placing stop-loss orders just beyond the opposite band to manage risk.
Each of these steps should be backtested against historical data to ensure consistency and reliability.
Risk Management Techniques for Volatility Breakouts
Volatility expansions following Bollinger Band compression can be sudden and aggressive. Without proper risk controls, even accurate predictions can result in losses due to slippage or unexpected reversals.
One key aspect is position sizing. Traders should only allocate a small portion of their portfolio—typically 1% to 5%—to any single trade. This helps mitigate the impact of false breakouts or whipsaws.
Another critical component is stop-loss placement. Given the unpredictable nature of crypto markets, stops should not be too tight, which may get triggered by normal price noise, nor too wide, which exposes capital unnecessarily.
Using trailing stops can also help protect profits during extended moves. For example, if a breakout leads to a rapid price surge, a trailing stop adjusts upward (or downward) to lock in gains while still allowing room for natural price fluctuations.
Lastly, always keep an eye on order book depth and liquidity levels. Thin order books during low volatility phases can lead to erratic price action once a breakout occurs.
Frequently Asked Questions
Q: What does it mean when Bollinger Bands stay narrow for a long time?A: Prolonged narrowness in Bollinger Bands typically indicates very low volatility, which often precedes a significant price movement. In crypto markets, this can lead to explosive moves once the consolidation phase ends.
Q: Can I use Bollinger Bands alone to make trading decisions?A: While Bollinger Bands are powerful, relying solely on them increases the risk of false signals. It's best to combine them with other tools such as volume indicators, support/resistance levels, or sentiment analysis.
Q: How often do Bollinger Bands compress to their narrowest in six months?A: In highly volatile assets like cryptocurrencies, this pattern may occur every few months, especially during sideways market conditions. However, the significance lies in the context surrounding the contraction, including volume and upcoming events.
Q: Should I trade immediately when the bands reach their narrowest point?A: No. It's generally safer to wait for a confirmed breakout or breakdown before entering a position. Premature entries can lead to losses if the price remains range-bound longer than expected.
Disclaimer:info@kdj.com
The information provided is not trading advice. kdj.com does not assume any responsibility for any investments made based on the information provided in this article. Cryptocurrencies are highly volatile and it is highly recommended that you invest with caution after thorough research!
If you believe that the content used on this website infringes your copyright, please contact us immediately (info@kdj.com) and we will delete it promptly.


- Bitcoin, eCash Fork, and Airdrop Dynamics: A Deep Dive into Crypto's Latest Controversies
- 2026-05-03 12:55:01
- Consensus 2026 Miami: Web3, Blockchain, Cryptocurrency, NFTs, Metaverse, Conference, May 5th — Where Wall Street Meets the Digital Frontier
- 2026-05-02 12:45:01
- Fed Holds Rates Steady, Triggering Bitcoin Price Drop Amidst Geopolitical Tensions
- 2026-05-01 06:45:01
- Bitcoin Miners Electrify the Grid: Ohio Gas Plant Acquisition Powers Up a New Era for Digital Gold
- 2026-05-01 00:45:01
- MegaETH's MEGA Token Hits the Big Apple: Setting New Performance Benchmarks for Real-Time Blockchain
- 2026-05-01 00:55:01
- Solana's Slippery Slope: Price Prediction Points to Resistance Loss and Potential Further Drops
- 2026-05-01 06:45:01
Related knowledge

What Is Crypto Bottom Indicator? How Do Traders Identify Market Lows?
Jul 21,2026 at 08:20am
Bitcoin Halving Mechanics1. Bitcoin’s protocol enforces a fixed issuance schedule where block rewards are cut in half approximately every 210,000 bloc...

What Is Crypto Trend Reversal Indicator? Which Signals Should You Watch?
Jul 24,2026 at 11:00am
Market Volatility Patterns1. Bitcoin price swings often exceed 5% within a single 24-hour window during high-liquidity events such as ETF inflow annou...

What Is Weekly Bitcoin Chart Indicator? Can It Predict Long-Term Trends?
Jul 22,2026 at 07:39am
Market Volatility Patterns1. Price swings in cryptocurrency markets often exceed 10% within a 24-hour window, driven by liquidity constraints and algo...

What Is 4 Hour Chart Indicator? Why Do Crypto Traders Use It?
Jul 23,2026 at 02:20pm
Market Volatility Patterns1. Bitcoin price swings often exceed 10% within a 24-hour window during high-liquidity events such as ETF approval announcem...

What Is Premium Index Indicator? Why Does It Matter in Futures Trading?
Jul 23,2026 at 06:59pm
Premium Index Definition and Composition1. The Premium Index is a real-time metric derived from the weighted average price difference between perpetua...

What Is Basis Indicator in Crypto Futures? How Do Traders Use It?
Jul 20,2026 at 11:59pm
Basis Indicator Definition and Core Mechanics1. The basis indicator measures the price difference between a cryptocurrency’s spot price and its corres...
What Is Crypto Bottom Indicator? How Do Traders Identify Market Lows?
Jul 21,2026 at 08:20am
Bitcoin Halving Mechanics1. Bitcoin’s protocol enforces a fixed issuance schedule where block rewards are cut in half approximately every 210,000 bloc...
What Is Crypto Trend Reversal Indicator? Which Signals Should You Watch?
Jul 24,2026 at 11:00am
Market Volatility Patterns1. Bitcoin price swings often exceed 5% within a single 24-hour window during high-liquidity events such as ETF inflow annou...
What Is Weekly Bitcoin Chart Indicator? Can It Predict Long-Term Trends?
Jul 22,2026 at 07:39am
Market Volatility Patterns1. Price swings in cryptocurrency markets often exceed 10% within a 24-hour window, driven by liquidity constraints and algo...
What Is 4 Hour Chart Indicator? Why Do Crypto Traders Use It?
Jul 23,2026 at 02:20pm
Market Volatility Patterns1. Bitcoin price swings often exceed 10% within a 24-hour window during high-liquidity events such as ETF approval announcem...
What Is Premium Index Indicator? Why Does It Matter in Futures Trading?
Jul 23,2026 at 06:59pm
Premium Index Definition and Composition1. The Premium Index is a real-time metric derived from the weighted average price difference between perpetua...
What Is Basis Indicator in Crypto Futures? How Do Traders Use It?
Jul 20,2026 at 11:59pm
Basis Indicator Definition and Core Mechanics1. The basis indicator measures the price difference between a cryptocurrency’s spot price and its corres...
See all articles


