-
 Bitcoin
 $108,802.0448
0.59% -
 Ethereum
 $2,556.7655
1.66% -
 Tether USDt
 $1.0001
-0.02% -
 XRP
XRP $2.2765
2.15% -
 BNB
BNB $662.6901
1.16% -
 Solana
 $151.4936
2.68% -
 USDC
USDC $0.9999
0.00% -
 TRON
TRON $0.2857
0.49% -
 Dogecoin
 $0.1704
4.33% -
 Cardano
 $0.5847
1.63% -
 Hyperliquid
 $39.2227
-0.47% -
 Sui
Sui $2.9110
0.60% -
 Bitcoin Cash
 $491.8681
1.55% -
 Chainlink
 $13.4311
2.12% -
 UNUS SED LEO
 $9.0273
0.09% -
 Avalanche
 $18.1653
1.64% -
 Stellar
 $0.2442
2.69% -
 Toncoin
 $2.8966
5.36% -
 Shiba Inu
 $0.0...01180
2.95% -
 Litecoin
 $87.8955
1.49% -
 Hedera
 $0.1573
1.30% -
 Monero
 $316.6881
0.88% -
 Polkadot
 $3.3938
1.37% -
 Dai
Dai $0.9999
-0.01% -
 Ethena USDe
 $1.0001
-0.01% -
 Bitget Token
 $4.3976
0.08% -
 Uniswap
 $7.4020
6.83% -
 Pepe
Pepe $0.0...01000
3.22% -
 Aave
Aave $276.6854
2.05% -
 Pi
Pi $0.4586
-0.62%
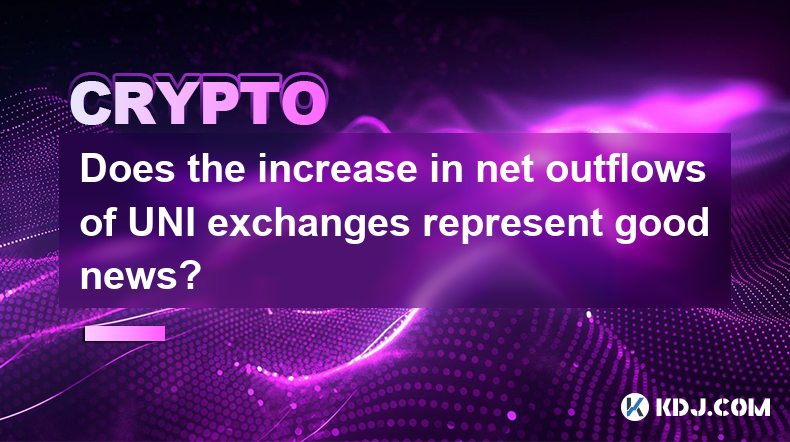
Does the increase in net outflows of UNI exchanges represent good news?
Increased net outflows of UNI from exchanges often signal bullish sentiment, as investors move tokens to personal wallets, potentially driving up the price due to reduced supply.
Apr 26, 2025 at 07:28 pm

The increase in net outflows of UNI exchanges can be a significant indicator for investors and enthusiasts within the cryptocurrency circle. Understanding the implications of this phenomenon requires a deep dive into what net outflows mean, why they occur, and how they can impact the price and perception of UNI, the native token of the Uniswap decentralized exchange.
What Are Net Outflows?
Net outflows from cryptocurrency exchanges refer to the total amount of a specific cryptocurrency, in this case, UNI, that is withdrawn from exchanges minus the total amount deposited. When net outflows increase, it means that more UNI tokens are being moved out of exchanges than are being moved in. This movement can be interpreted in various ways, but generally, it is seen as a bullish signal. When users withdraw their tokens from exchanges, it often indicates that they intend to hold onto them for the long term, reducing the immediate selling pressure on the token.
Reasons Behind Increased Net Outflows
Several factors can contribute to an increase in net outflows of UNI. One primary reason is the anticipation of price appreciation. If investors believe that the value of UNI will rise, they may choose to move their tokens to personal wallets to avoid the risk of exchange hacks and to secure their holdings. Another reason could be related to staking or participating in governance. Uniswap offers users the ability to stake their UNI tokens to vote on proposals and earn rewards, which can be a compelling reason to move tokens off exchanges.
Additionally, regulatory concerns can drive net outflows. If there are rumors or news about potential regulatory actions against cryptocurrency exchanges, users might rush to withdraw their assets to protect themselves from potential freezes or seizures. Lastly, market sentiment plays a crucial role. Positive news or developments related to Uniswap, such as new features or partnerships, can boost investor confidence, leading to increased net outflows.
Impact on UNI's Price
The increase in net outflows can have a direct impact on UNI's price. When there is a significant amount of UNI being withdrawn from exchanges, it reduces the supply available for trading. According to basic economic principles, a decrease in supply with constant or increasing demand can lead to a rise in price. Therefore, an increase in net outflows is often seen as a positive sign for UNI's price.
However, it's essential to consider other market factors as well. The overall market sentiment, trading volume, and macroeconomic conditions can influence UNI's price alongside net outflows. For instance, if the broader cryptocurrency market is experiencing a downturn, even increased net outflows might not be enough to prevent a price drop.
Analyzing Historical Data
To better understand the impact of net outflows on UNI, analyzing historical data can provide valuable insights. By looking at past instances where net outflows increased, investors can identify patterns and correlations with price movements. For example, if historical data shows that periods of high net outflows consistently precede price increases, this could reinforce the bullish sentiment around current outflows.
It's also important to consider the magnitude of the outflows. A small increase might not have a significant impact, while a large surge could signal a more substantial shift in market dynamics. Additionally, comparing net outflows of UNI to those of other cryptocurrencies can provide a broader context. If similar patterns are observed across multiple tokens, it might indicate a broader market trend rather than a UNI-specific phenomenon.
Practical Implications for Investors
For investors, understanding the implications of increased net outflows of UNI can help inform their trading and investment strategies. If you're considering buying UNI, a period of high net outflows might be seen as an opportune time, as it could indicate that the price is likely to rise. Conversely, if you're holding UNI and considering selling, you might want to wait until the outflows stabilize or decrease, as selling during a period of high outflows could mean missing out on potential price increases.
Here are some practical steps investors can take to leverage this information:
- Monitor net outflow data: Use tools and platforms that provide real-time data on net outflows of UNI. Websites like Glassnode or CryptoQuant offer detailed insights into exchange flows.
- Analyze historical correlations: Look at past data to see how net outflows have correlated with price movements. This can help you predict future price trends more accurately.
- Stay informed about Uniswap developments: Keep an eye on news and updates from Uniswap, as positive developments can drive increased net outflows.
- Diversify your portfolio: While net outflows can be a useful indicator, it's important not to rely solely on this metric. Diversify your investments to mitigate risk.
FAQs
Q: Can net outflows alone predict UNI's price movements?
A: While net outflows can be a strong indicator of potential price movements, they should not be used in isolation. Other factors such as market sentiment, trading volume, and broader economic conditions also play a significant role in determining UNI's price.
Q: How frequently should I check net outflow data for UNI?
A: The frequency of checking net outflow data depends on your investment strategy. If you're a day trader, you might want to check it multiple times a day. For long-term investors, weekly or monthly checks might be sufficient.
Q: Are there any risks associated with holding UNI off exchanges during periods of high net outflows?
A: Yes, there are risks. Holding UNI in personal wallets means you're responsible for the security of your assets. If you lose your private keys or if your wallet is compromised, you could lose your UNI. Additionally, if you need to sell quickly, moving tokens from a personal wallet back to an exchange can take time.
Q: How can I access net outflow data for UNI?
A: You can access net outflow data for UNI through various blockchain analytics platforms. Websites like Glassnode, CryptoQuant, and Nansen provide detailed data on exchange flows, including net outflows for UNI.
Disclaimer:info@kdj.com
The information provided is not trading advice. kdj.com does not assume any responsibility for any investments made based on the information provided in this article. Cryptocurrencies are highly volatile and it is highly recommended that you invest with caution after thorough research!
If you believe that the content used on this website infringes your copyright, please contact us immediately (info@kdj.com) and we will delete it promptly.
- Litecoin Breakout Watch: What Traders Need to Know Now
- 2025-07-06 16:50:13
- Bitcoin, Solana, Ethereum: Decoding the Latest Buzz on the Blockchain
- 2025-07-06 16:50:13
- Widnes Resident's 50p Could Be Your Ticket to Easy Street: Rare Coin Mania!
- 2025-07-06 16:55:13
- Bitcoin, Solaris Presale, and Token Rewards: What's the Buzz?
- 2025-07-06 16:55:13
- Ethereum Under Pressure: Price Drop Amid Global Uncertainties
- 2025-07-06 17:00:13
- XRP, SEC Case, and Prosperity: A New Era for XRP Holders?
- 2025-07-06 17:10:13
Related knowledge

How to customize USDT TRC20 mining fees? Flexible adjustment tutorial
Jun 13,2025 at 01:42am
Understanding USDT TRC20 Mining FeesMining fees on the TRON (TRC20) network are essential for processing transactions. Unlike Bitcoin or Ethereum, where miners directly validate transactions, TRON uses a delegated proof-of-stake (DPoS) mechanism. However, users still need to pay bandwidth and energy fees, which are collectively referred to as 'mining fe...

USDT TRC20 transaction is stuck? Solution summary
Jun 14,2025 at 11:15pm
Understanding USDT TRC20 TransactionsWhen users mention that a USDT TRC20 transaction is stuck, they typically refer to a situation where the transfer of Tether (USDT) on the TRON blockchain has not been confirmed for an extended period. This issue may arise due to various reasons such as network congestion, insufficient transaction fees, or wallet-rela...

How to cancel USDT TRC20 unconfirmed transactions? Operation guide
Jun 13,2025 at 11:01pm
Understanding USDT TRC20 Unconfirmed TransactionsWhen dealing with USDT TRC20 transactions, it’s crucial to understand what an unconfirmed transaction means. An unconfirmed transaction is one that has been broadcasted to the blockchain network but hasn’t yet been included in a block. This typically occurs due to low transaction fees or network congestio...

How to check USDT TRC20 balance? Introduction to multiple query methods
Jun 21,2025 at 02:42am
Understanding USDT TRC20 and Its ImportanceUSDT (Tether) is one of the most widely used stablecoins in the cryptocurrency market. It exists on multiple blockchain networks, including TRC20, which operates on the Tron (TRX) network. Checking your USDT TRC20 balance accurately is crucial for users who hold or transact with this asset. Whether you're sendi...

What to do if USDT TRC20 transfers are congested? Speed up trading skills
Jun 13,2025 at 09:56am
Understanding USDT TRC20 Transfer CongestionWhen transferring USDT TRC20, users may occasionally experience delays or congestion. This typically occurs due to network overload on the TRON blockchain, which hosts the TRC20 version of Tether. Unlike the ERC20 variant (which runs on Ethereum), TRC20 transactions are generally faster and cheaper, but during...

The relationship between USDT TRC20 and TRON chain: technical background analysis
Jun 12,2025 at 01:28pm
What is USDT TRC20?USDT TRC20 refers to the Tether (USDT) token issued on the TRON blockchain using the TRC-20 standard. Unlike the more commonly known ERC-20 version of USDT (which runs on Ethereum), the TRC-20 variant leverages the TRON network's infrastructure for faster and cheaper transactions. The emergence of this version came as part of Tether’s...

How to customize USDT TRC20 mining fees? Flexible adjustment tutorial
Jun 13,2025 at 01:42am
Understanding USDT TRC20 Mining FeesMining fees on the TRON (TRC20) network are essential for processing transactions. Unlike Bitcoin or Ethereum, where miners directly validate transactions, TRON uses a delegated proof-of-stake (DPoS) mechanism. However, users still need to pay bandwidth and energy fees, which are collectively referred to as 'mining fe...

USDT TRC20 transaction is stuck? Solution summary
Jun 14,2025 at 11:15pm
Understanding USDT TRC20 TransactionsWhen users mention that a USDT TRC20 transaction is stuck, they typically refer to a situation where the transfer of Tether (USDT) on the TRON blockchain has not been confirmed for an extended period. This issue may arise due to various reasons such as network congestion, insufficient transaction fees, or wallet-rela...

How to cancel USDT TRC20 unconfirmed transactions? Operation guide
Jun 13,2025 at 11:01pm
Understanding USDT TRC20 Unconfirmed TransactionsWhen dealing with USDT TRC20 transactions, it’s crucial to understand what an unconfirmed transaction means. An unconfirmed transaction is one that has been broadcasted to the blockchain network but hasn’t yet been included in a block. This typically occurs due to low transaction fees or network congestio...

How to check USDT TRC20 balance? Introduction to multiple query methods
Jun 21,2025 at 02:42am
Understanding USDT TRC20 and Its ImportanceUSDT (Tether) is one of the most widely used stablecoins in the cryptocurrency market. It exists on multiple blockchain networks, including TRC20, which operates on the Tron (TRX) network. Checking your USDT TRC20 balance accurately is crucial for users who hold or transact with this asset. Whether you're sendi...

What to do if USDT TRC20 transfers are congested? Speed up trading skills
Jun 13,2025 at 09:56am
Understanding USDT TRC20 Transfer CongestionWhen transferring USDT TRC20, users may occasionally experience delays or congestion. This typically occurs due to network overload on the TRON blockchain, which hosts the TRC20 version of Tether. Unlike the ERC20 variant (which runs on Ethereum), TRC20 transactions are generally faster and cheaper, but during...

The relationship between USDT TRC20 and TRON chain: technical background analysis
Jun 12,2025 at 01:28pm
What is USDT TRC20?USDT TRC20 refers to the Tether (USDT) token issued on the TRON blockchain using the TRC-20 standard. Unlike the more commonly known ERC-20 version of USDT (which runs on Ethereum), the TRC-20 variant leverages the TRON network's infrastructure for faster and cheaper transactions. The emergence of this version came as part of Tether’s...
See all articles


