


歷史高
歷史最低
體積(24小時)
0
週轉率
0%
市值
395.0338K
FDV
395K
循環供應
10M
總供應量
10M
最大供應量
10M
標籤
網站
探險家
貨幣計算器
{{conversion_one_currency}}
{{conversion_two_currency}}

| 交換 | 對 | 價格 | 體積 (24h) | 體積 % | 信心 | Liquidity Score | 賺 |
|---|---|---|---|---|---|---|---|
| {{val.marketPair}} | {{val.price}} | {{val.volume24h}} | {{val.volumePercent}} | 低的 緩和 高的 | {{val.effectiveLiquidity}} | 買 /出售 | |
社區情緒

26%
74%


看漲

看跌


| 交換 | Pair | 價格 | 體積 (24h) | 體積 % | 信心 | Liquidity Score | 賺 |
|---|---|---|---|---|---|---|---|
| {{val.marketPair}} | {{val.price}} | {{val.volume24h}} | {{val.volumePercent}} | 低的 緩和 高的 | {{val.effectiveLiquidity}} | 買 /出售 | |
TypeAI 資訊
-

總部位於美國的加密貨幣交易所Coinbase已向印度金融情報部門(FIU-IND)註冊,以提供全國的加密貨幣交易服務
2025-03-12 18:55:54
-

Class action waivers are often deployed by companies to help reduce financial risk, but opponents argue they can limit consumers' rights and prevent company accountability.
2025-01-18 22:20:34
-

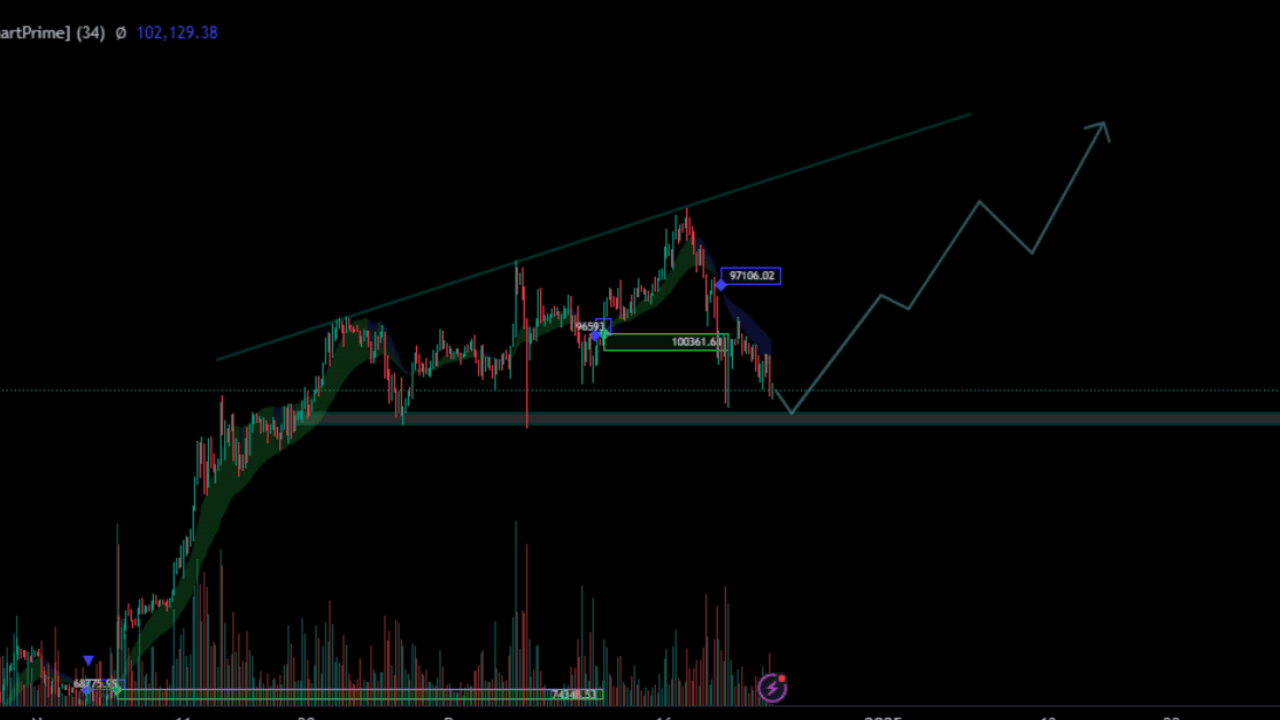
根據提供的圖表,它似乎透過多個指標描述了 BTC/USDT 的價格走勢。價格正在 10 萬美元附近的關鍵阻力位下方盤整。 MACD 和 RSI 等指標顯示動能參差不齊。如果 RSI 趨於超買且 MACD 顯示看漲背離,則情緒傾向於看漲;否則,看跌。
2025-01-06 17:03:34
-
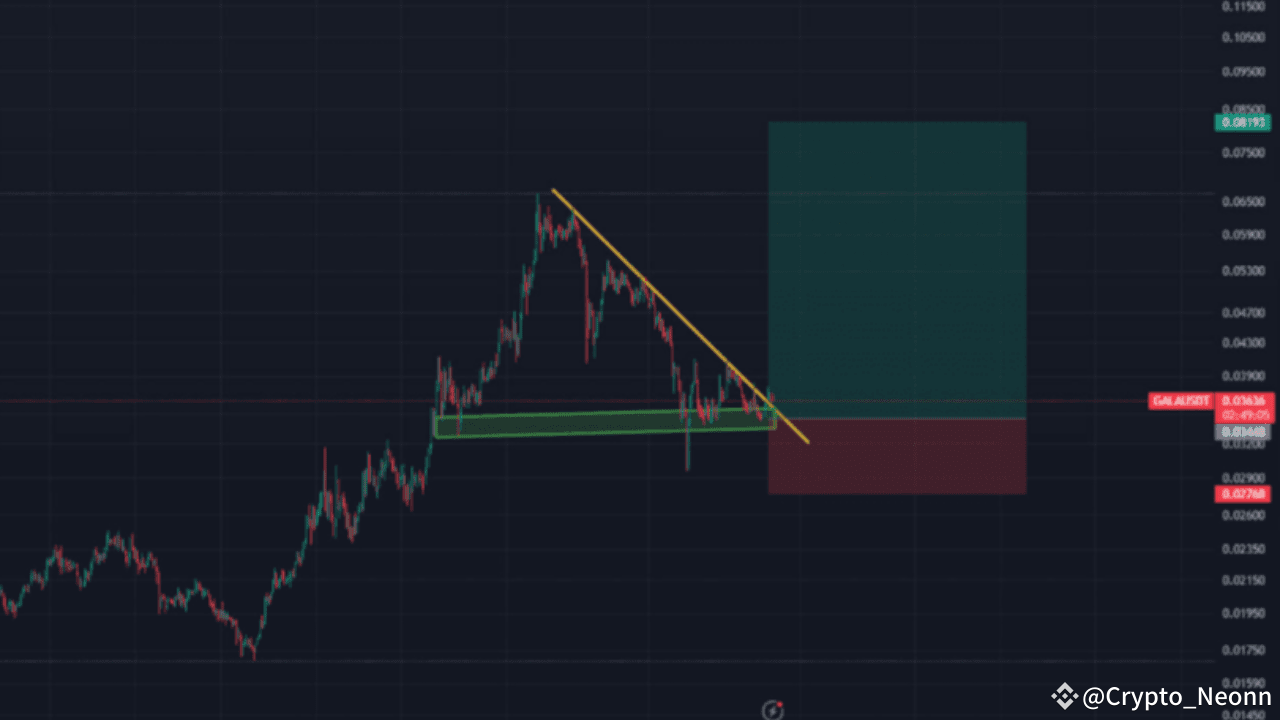
GALA 圖表顯示短期下降趨勢,價格跌破傾斜阻力線且 RSI 走弱。然而,長期前景
2024-12-29 21:05:54
-
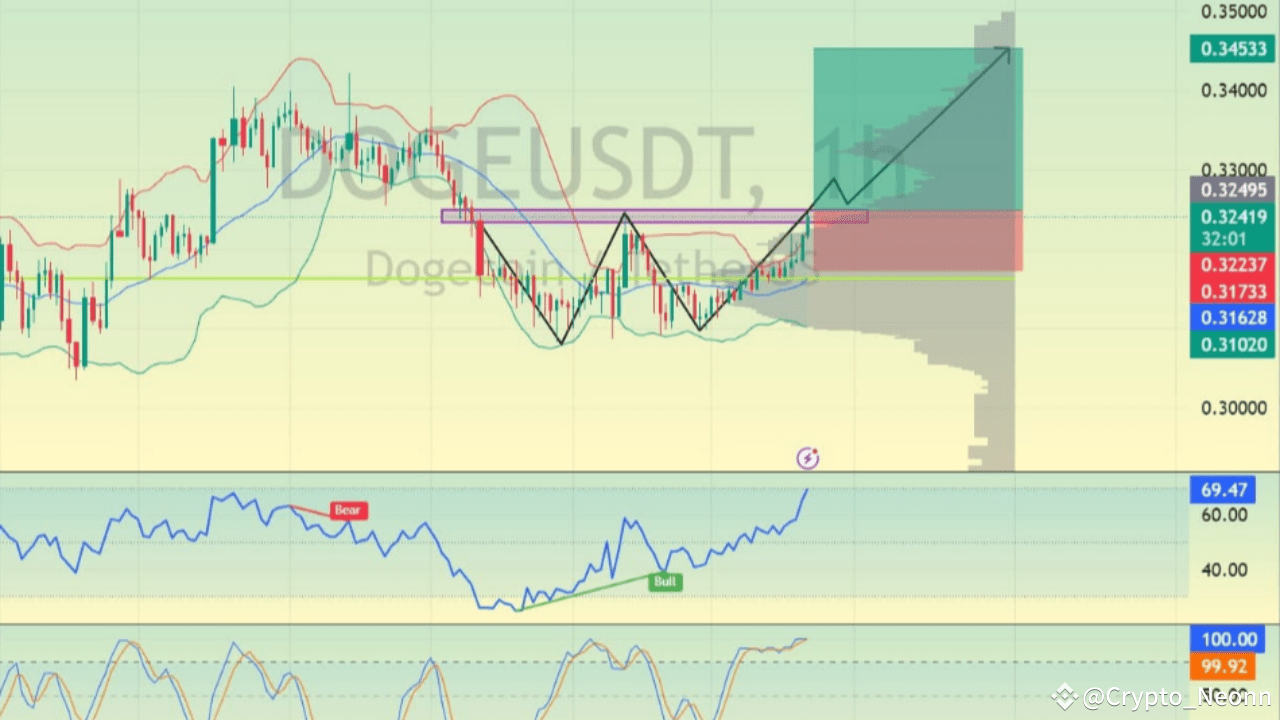
DOGE/USDT 圖表顯示出長期上漲的跡象。指標顯示買盤活動強勁,RSI 上升,隨機振盪指標顯示已從超賣水平恢復。
2024-12-29 17:07:16
-

This chart shows the GALA/USDT (Gala to Tether) price movement in the 1-hour timeframe. The current price is $0.03593, with a potential bullish target near $0.05, a 40.62% rise. The highlighted arrow indicates a significant upward movement expectation. Support and resistance levels are marked (e.g., $0.04 support). The green trend line suggests an uptrend, and the blue zones represent resistance areas. The "Zero-Lag MA Trend Levels" and the current market dynamics indicate possible bullish momentum. Buyers might push prices higher if the support holds and resistance breaks. This setup is bullish but requires caution for confirmation.
2024-12-27 04:03:32
-
該分析表明 BTC/USDT 目前處於關鍵支撐位,與價值區域低點 (VAL) 一致——一個重要的價格水平
2024-12-24 03:06:26
-

此圖表顯示了 1 天時間範圍內的 WLD/USDT 貨幣對。價格正在形成上升楔形形態,通常被視為看漲。
2024-12-22 01:02:18
-
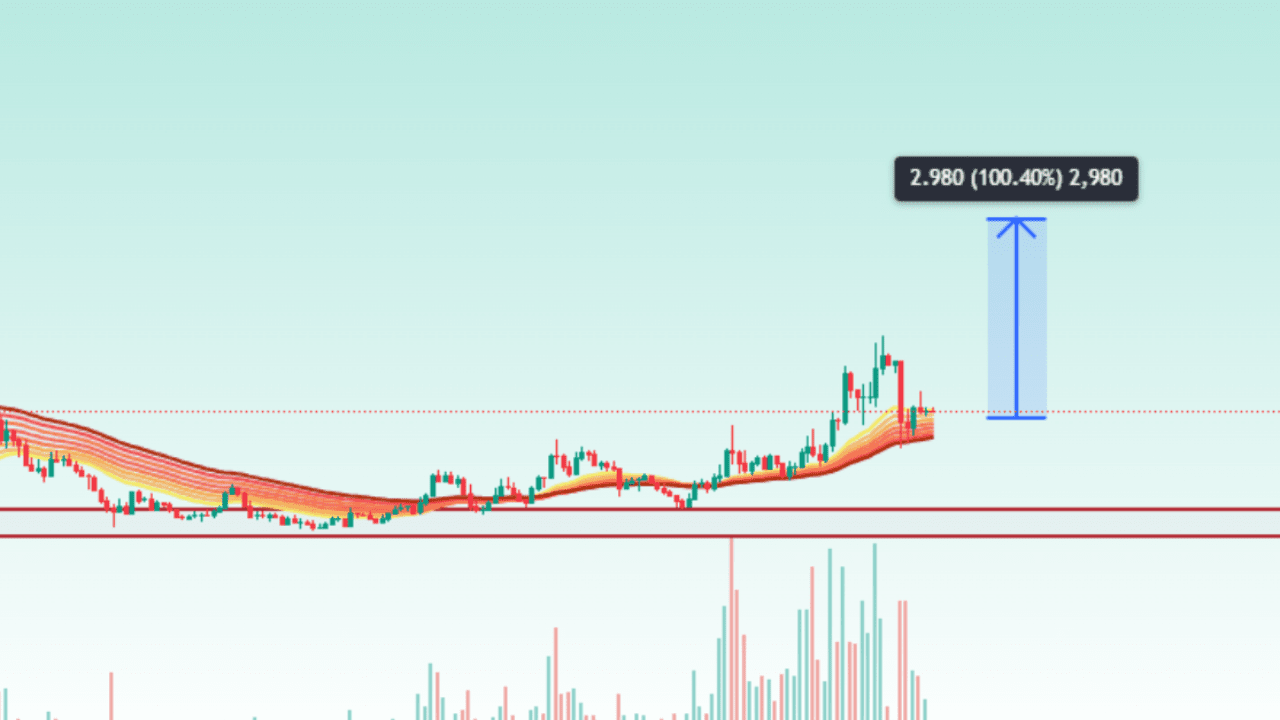
此圖表顯示了 1 天時間範圍內的 WLD/USDT,顯示潛在的看漲趨勢。價格最近突破了阻力位,並受到 EMA 絲帶(彩色線)的支撐。成交量大幅增加,證實了強勁的購買興趣。該圖表預計將上漲 100.40%,如藍色箭頭所示,目標價格接近 6.00 美元。 RSI 約為 61,顯示在不超買的情況下還有進一步上漲的空間。如果價格保持在關鍵支撐區域(以紅色標記)上方,則可能會繼續看漲至目標位置。這種設置標誌著市場強勁的潛在反彈。
2024-12-14 16:04:49
類似的硬幣


推特
GitHub
收盤