


All-time High
All-time Low
Volume(24h)
0
Turnover rate
0%
Market Cap
395.0338K
FDV
395K
Circulating supply
10M
Total supply
10M
Max supply
10M
Tags
Website
Contracts
Explorers
Currency Calculator
{{conversion_one_currency}}
{{conversion_two_currency}}

| Exchange | Pairs | Price | Volume (24h) | Volume % | Confidence | Liquidity Score | Earn |
|---|---|---|---|---|---|---|---|
| {{val.marketPair}} | {{val.price}} | {{val.volume24h}} | {{val.volumePercent}} | Low Moderate High | {{val.effectiveLiquidity}} | Buy / Sell | |
Community sentiment

26%
74%


Bullish

Bearish


| Exchange | Pair | Price | Volume (24h) | Volume % | Confidence | Liquidity Score | Earn |
|---|---|---|---|---|---|---|---|
| {{val.marketPair}} | {{val.price}} | {{val.volume24h}} | {{val.volumePercent}} | Low Moderate High | {{val.effectiveLiquidity}} | Buy / Sell | |
TypeAI News
-

US-based cryptocurrency exchange Coinbase has registered with the Financial Intelligence Unit – India (FIU-IND) to offer cryptocurrency trading services in the nation
Mar 12, 2025 at 06:55 pm
-

Class action waivers are often deployed by companies to help reduce financial risk, but opponents argue they can limit consumers' rights and prevent company accountability.
Jan 18, 2025 at 10:20 pm
-

Based on the provided chart, it appears to depict BTC/USDT price action with multiple indicators. The price is consolidating below key resistance levels near $100,000. Indicators like MACD and RSI suggest mixed momentum. If RSI trends toward overbought and MACD shows bullish divergence, the sentiment leans bullish; otherwise, bearish.
Jan 06, 2025 at 05:03 pm
-
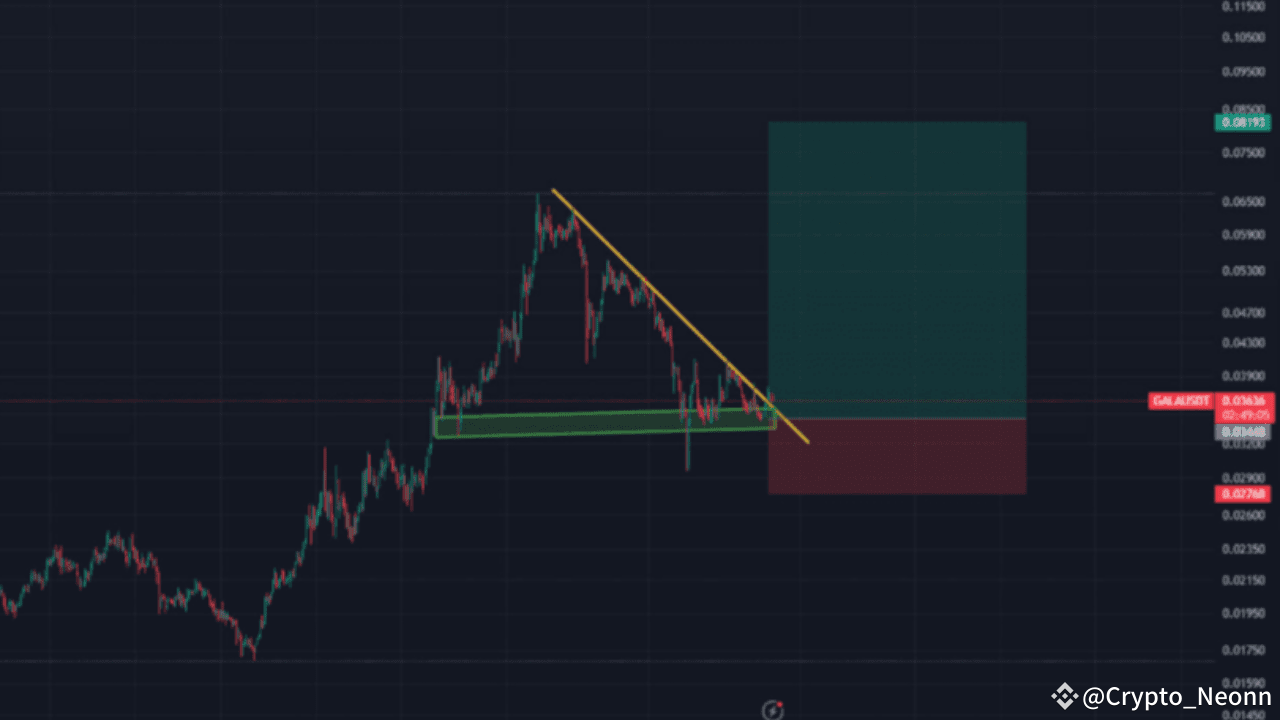
The GALA chart shows a short-term downtrend, with the price moving below a sloping resistance line and weakening RSI. However, the long-term outlook
Dec 29, 2024 at 09:05 pm
-
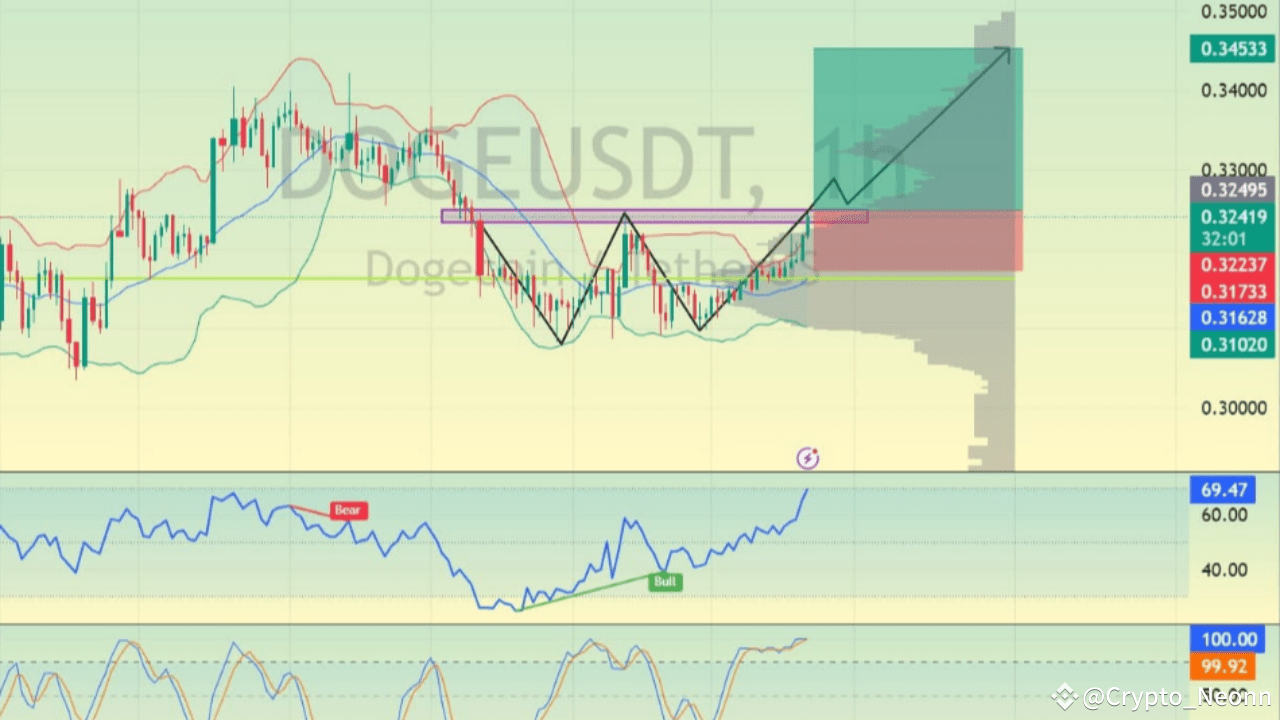
The DOGE/USDT chart shows signs of going up over a longer period. Indicators suggest strong buying activity, with the RSI rising and the stochastic oscillator showing recovery from oversold levels.
Dec 29, 2024 at 05:07 pm
-

This chart shows the GALA/USDT (Gala to Tether) price movement in the 1-hour timeframe. The current price is $0.03593, with a potential bullish target near $0.05, a 40.62% rise. The highlighted arrow indicates a significant upward movement expectation. Support and resistance levels are marked (e.g., $0.04 support). The green trend line suggests an uptrend, and the blue zones represent resistance areas. The "Zero-Lag MA Trend Levels" and the current market dynamics indicate possible bullish momentum. Buyers might push prices higher if the support holds and resistance breaks. This setup is bullish but requires caution for confirmation.
Dec 27, 2024 at 04:03 am
-
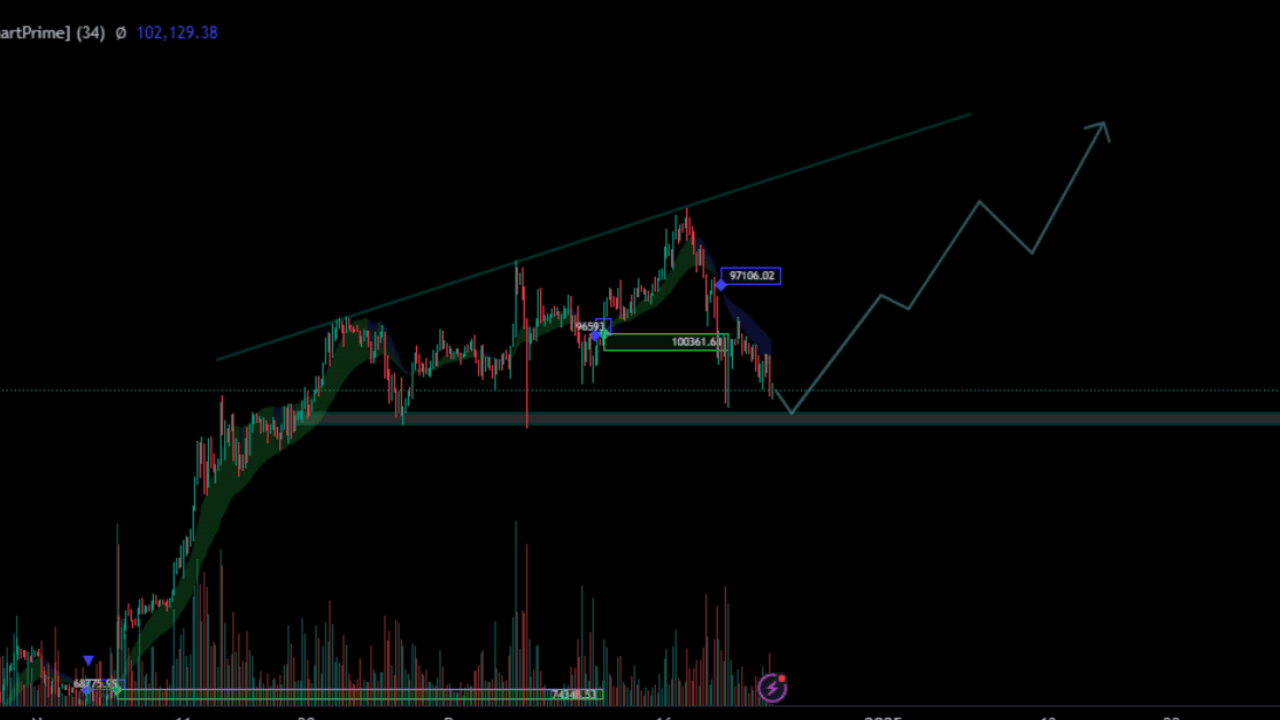
This analysis suggests BTC/USDT is currently at a crucial support level that coincides with the Value Area Low (VAL)—a significant price level
Dec 24, 2024 at 03:06 am
-

This chart shows the WLD/USDT pair on a 1-day timeframe. The price is forming an ascending wedge pattern, often seen as bullish.
Dec 22, 2024 at 01:02 am
-
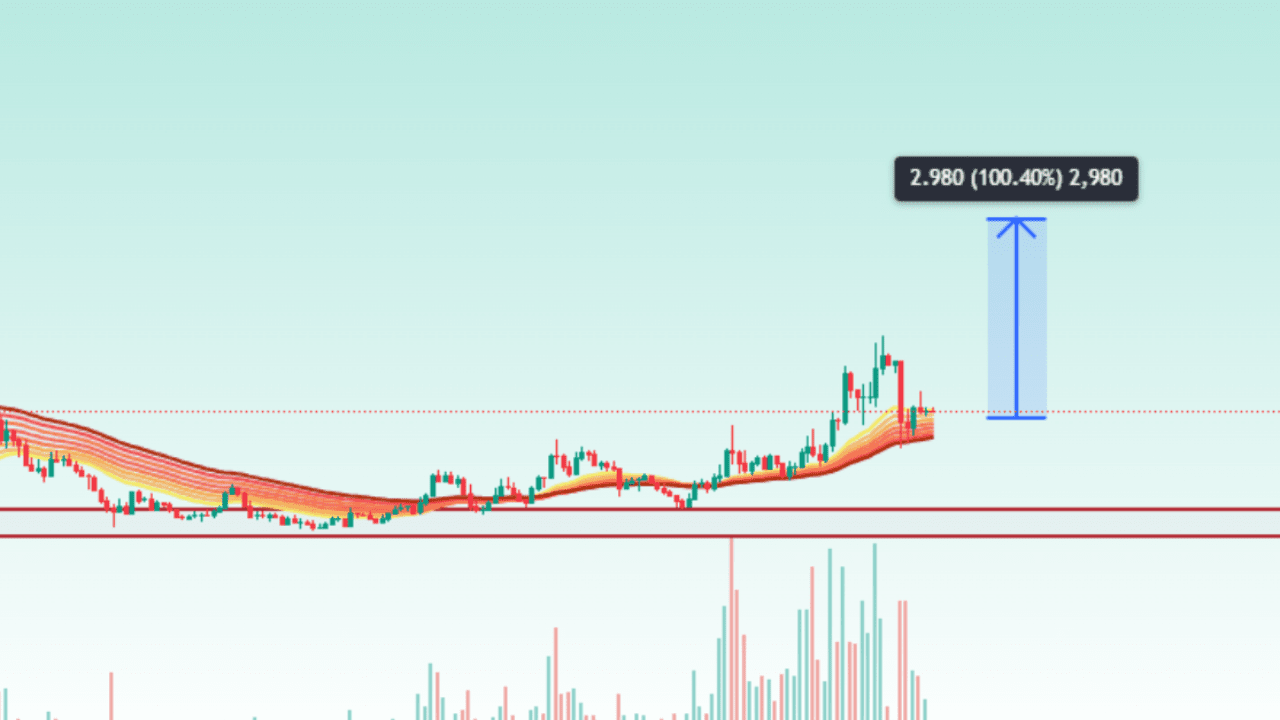
This chart shows WLD/USDT on a 1-day timeframe, indicating a potential bullish trend. The price recently broke above resistance levels and is supported by the EMA Ribbon (colored lines). Volume has increased significantly, confirming strong buying interest. The chart projects a 100.40% upward move, shown by the blue arrow, with a target price near $6.00. RSI is around 61, suggesting room for more upward movement without being overbought. If the price holds above key support zones (marked in red), a bullish continuation toward the target is likely. This setup signals a strong potential rally in the market.
Dec 14, 2024 at 04:04 pm
Similar Coins


Twitter
GitHub
Close