


历史最高价
历史最低价
成交额(24h)
0
换手率
0%
市值
395.0338K
FDV
395K
流通量
10M
总发行量
10M
最大发行量
10M
标签
网站
探索者
汇率计算器
{{conversion_one_currency}}
{{conversion_two_currency}}

| 交易所 | 交易对 | 价格 | 成交额 (24h) | 成交额 % | 信心 | Liquidity Score | 赚取 |
|---|---|---|---|---|---|---|---|
| {{val.marketPair}} | {{val.price}} | {{val.volume24h}} | {{val.volumePercent}} | 低 适中 高 | {{val.effectiveLiquidity}} | 买入 / 卖出 | |
社区情绪

26%
74%


看涨

看跌


| 交易所 | Pair | 价格 | 成交额 (24h) | 成交额 % | 信心 | Liquidity Score | 赚取 |
|---|---|---|---|---|---|---|---|
| {{val.marketPair}} | {{val.price}} | {{val.volume24h}} | {{val.volumePercent}} | 低 适中 高 | {{val.effectiveLiquidity}} | 买入 / 卖出 | |
TypeAI 资讯
-

总部位于美国的加密货币交易所Coinbase已向印度金融情报部门(FIU-IND)注册,以提供全国的加密货币交易服务
2025-03-12 18:55:54
-

Class action waivers are often deployed by companies to help reduce financial risk, but opponents argue they can limit consumers' rights and prevent company accountability.
2025-01-18 22:20:34
-

根据提供的图表,它似乎通过多个指标描述了 BTC/USDT 的价格走势。价格正在 100,000 美元附近的关键阻力位下方盘整。 MACD 和 RSI 等指标显示动能参差不齐。如果RSI趋于超买且MACD显示看涨背离,则市场情绪倾向于看涨;否则,看跌。
2025-01-06 17:03:34
-
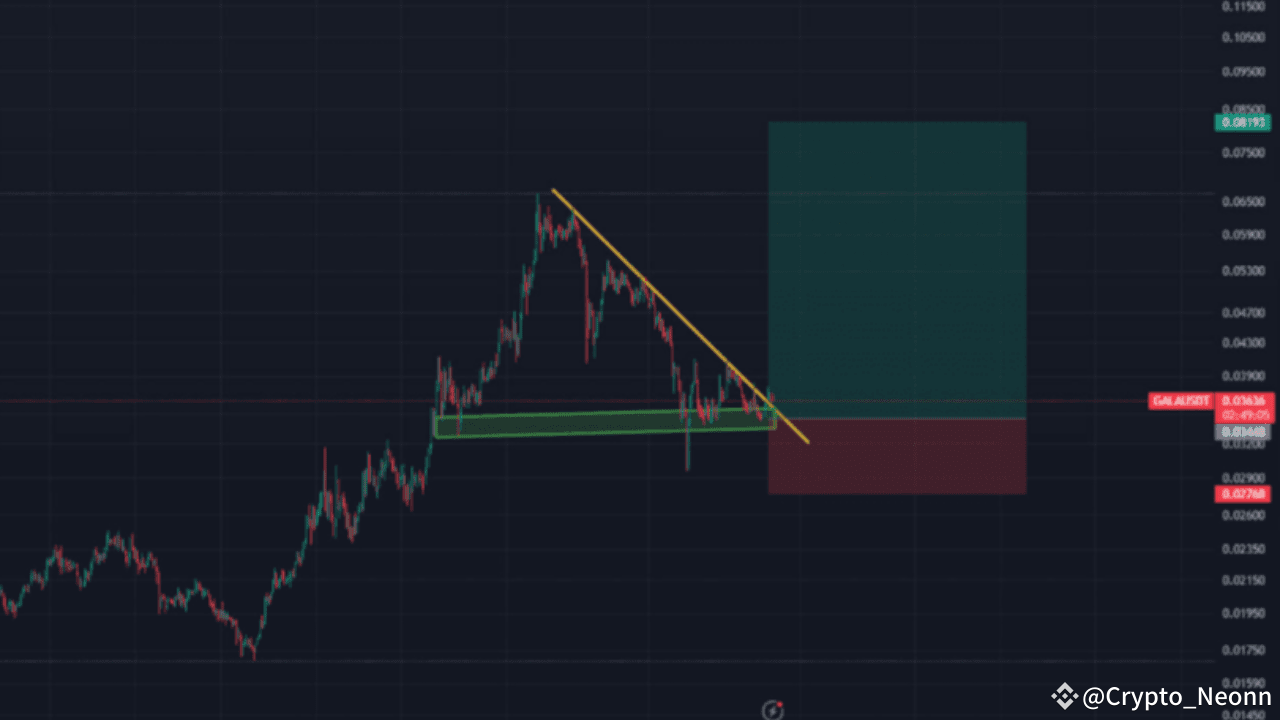
GALA 图表显示短期下降趋势,价格跌破倾斜阻力线且 RSI 走弱。然而,长期前景
2024-12-29 21:05:54
-
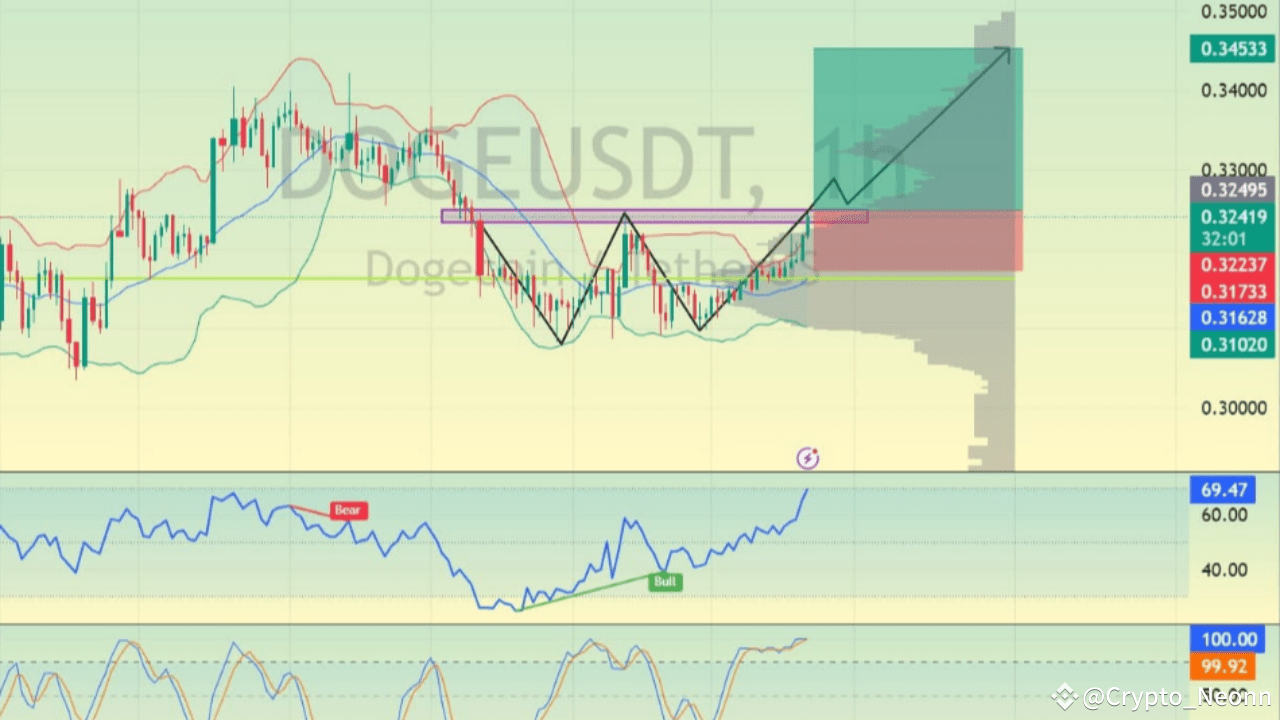
DOGE/USDT 图表显示出长期上涨的迹象。指标表明买盘活动强劲,RSI 上升,随机振荡指标显示已从超卖水平恢复。
2024-12-29 17:07:16
-

This chart shows the GALA/USDT (Gala to Tether) price movement in the 1-hour timeframe. The current price is $0.03593, with a potential bullish target near $0.05, a 40.62% rise. The highlighted arrow indicates a significant upward movement expectation. Support and resistance levels are marked (e.g., $0.04 support). The green trend line suggests an uptrend, and the blue zones represent resistance areas. The "Zero-Lag MA Trend Levels" and the current market dynamics indicate possible bullish momentum. Buyers might push prices higher if the support holds and resistance breaks. This setup is bullish but requires caution for confirmation.
2024-12-27 04:03:32
-
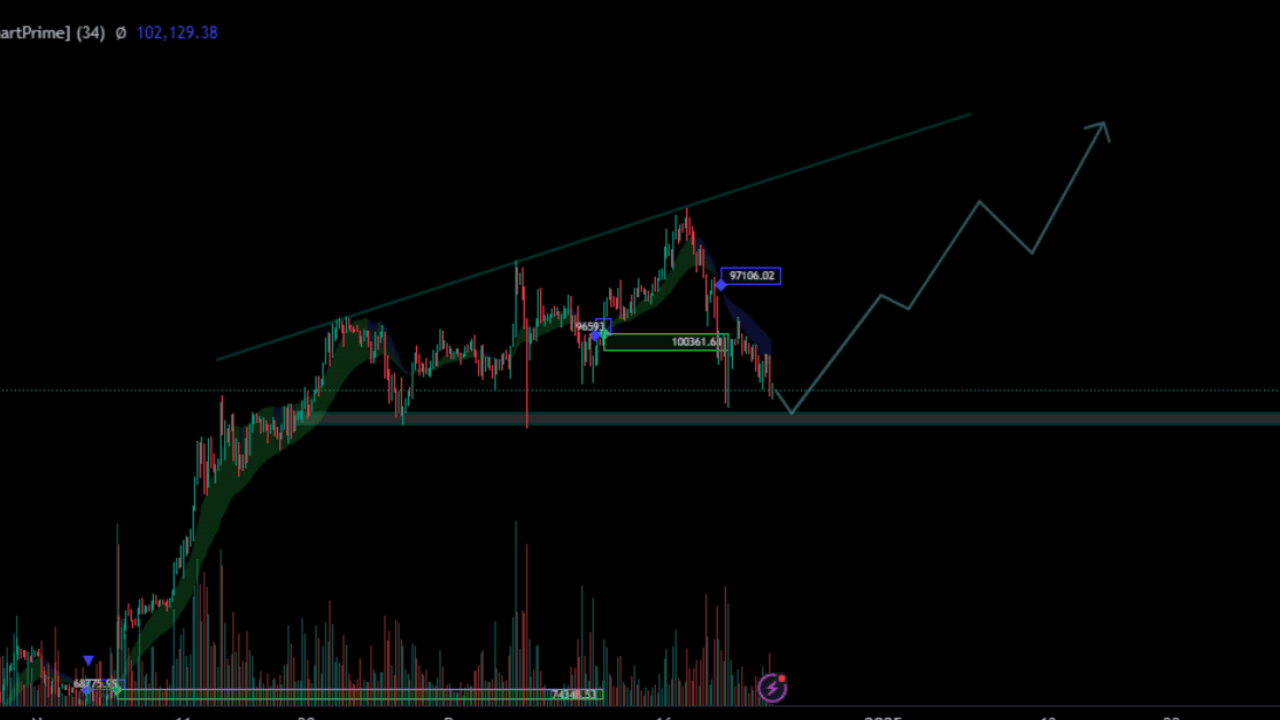
该分析表明 BTC/USDT 目前处于关键支撑位,与价值区域低点 (VAL) 一致——一个重要的价格水平
2024-12-24 03:06:26
-

此图表显示了 1 天时间范围内的 WLD/USDT 货币对。价格正在形成上升楔形形态,通常被视为看涨。
2024-12-22 01:02:18
-
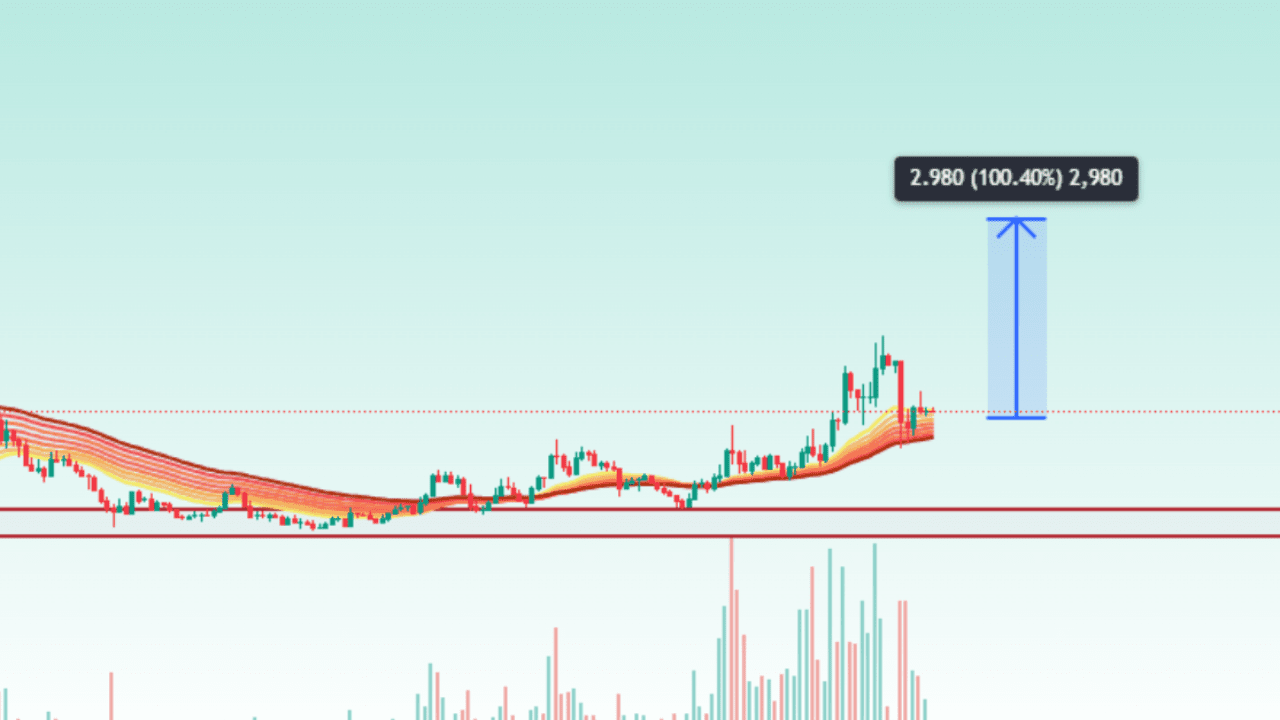
该图表显示了 1 天时间范围内的 WLD/USDT,表明潜在的看涨趋势。价格最近突破了阻力位,并受到 EMA 丝带(彩色线)的支撑。成交量大幅增加,证实了强劲的购买兴趣。该图表预计上涨 100.40%,如蓝色箭头所示,目标价格接近 6.00 美元。 RSI 约为 61,表明在不超买的情况下还有进一步上涨的空间。如果价格保持在关键支撑区域(以红色标记)上方,则可能会继续看涨至目标。这种设置预示着市场强劲的潜在反弹。
2024-12-14 16:04:49
相似代币


推特
GitHub
关闭