 |
|
 |
|
 |
|
 |
|
 |
|
 |
|
 |
|
 |
|
 |
|
 |
|
 |
|
 |
|
 |
|
 |
|
 |
|
デジタル資産市場は、過去数週間にわたってボラティリティに満ちており、Solana(SoL)は例外ではありませんでした。

The digital asset market has been subject to significant volatility in recent weeks, and Solana (SOL) has not been an exception. As its price has seen a recent setback, some indicators suggest that SOL might be gearing up for a potential bullish cycle.
デジタル資産市場はここ数週間で大幅なボラティリティの影響を受けており、Solana(SOL)は例外ではありませんでした。その価格が最近の後退を見たように、いくつかの指標は、Solが潜在的な強気サイクルに向けて準備を整えている可能性があることを示唆しています。
Solana’s price rebounded from a session low of $96 to close near $107, showcasing some resilience. This upward movement was further buoyed by global news, particularly the decision to halt the implementation of higher tariffs on several countries, which pushed the price up to $119.
Solanaの価格は、96ドルの最低セッションから107ドル近くを閉鎖するために回復し、いくつかの回復力を示しました。この上向きの動きは、グローバルなニュース、特にいくつかの国でのより高い関税の実施を停止するという決定によってさらに支えられ、価格を119ドルに押し上げました。
However, despite this positive move, SOL experienced a 4% setback today as the market shifts its attention to the U.S. inflation report for March.
しかし、この前向きな動きにもかかわらず、Solは3月の米国インフレ報告書に市場が注目を集めているため、今日4%の後退を経験しました。
The inflation rate came in at 2.4%, which was 20 basis points lower than the analysts’ consensus estimate. Usually, such an underperformance would likely lead to a crypto market rally. But the looming tariffs are casting a shadow over the market, preventing broader enthusiasm. This uncertainty continues to dampen investor sentiment.
インフレ率は2.4%であり、これはアナリストのコンセンサスの見積もりよりも20ベーシスポイント低いものでした。通常、そのようなパフォーマンスが暗号市場の集会につながる可能性があります。しかし、迫り来る関税は市場に影を落としており、より広い熱意を妨げています。この不確実性は、投資家の感情を弱め続けています。
FART Coin Drives DEX Trading Volumes Higher
おならコインは、DEXの取引量を高く駆動します
A major catalyst for the recent increase in Solana’s decentralized finance (DeFi) activity has been the surge in FART, a Solana-based meme coin. FART has taken the market by surprise as its price has nearly doubled in the past week while many other digital assets have faced steep declines.
ソラナの分散財政(defi)活動の最近の増加の主要な触媒は、ソラナを拠点とするミームコインであるオナラの急増でした。他の多くのデジタル資産が急な減少に直面している一方で、その価格がほぼ2倍になったため、おならは市場を驚かせました。
Trading volumes for FART in the past 24 hours have soared by 56%, reaching nearly $432 million. Among these volumes, a large portion is being driven by the FART/SOL pair on Solana-based DEXs like Orca and Raydium.
過去24時間のおならの取引量は56%上昇し、4億3,200万ドル近くに達しました。これらのボリュームの中で、大部分は、OrcaやRaydiumなどのSolanaベースのDexsのおなら/Solペアによって駆動されています。
The price action in meme coins often triggers a broader speculative frenzy, and this momentum could potentially spill over into other Solana-based assets, including SOL itself.
ミームコインの価格アクションは、しばしばより広い投機的な狂乱を引き起こし、この勢いはSol自体を含む他のソラナベースの資産に潜在的に流出する可能性があります。
The increase in trading volumes on Solana DEXs has been substantial, with the first 9 days of the month showing a 23.5% increase over March’s volumes. This uptick suggests that the market could be starting to reverse its downtrend, especially if meme coins like FART continue to rally.
Solana Dexsの取引量の増加はかなりのものであり、月の最初の9日間は3月の量で23.5%の増加を示しています。この上昇は、特におならのようなミームコインが集会を続けている場合、市場が下降トレンドを逆転し始めている可能性があることを示唆しています。
Solana’s Price Action and Technical Indicators
Solanaの価格アクションと技術指標
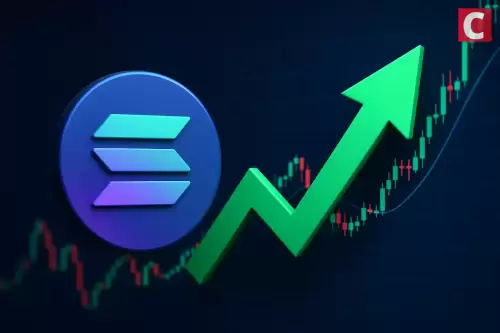
Looking at Solana’s price chart, SOL bounced off a key support level this week, offering some hope for a bullish recovery. Momentum indicators have shown slight improvement, further adding to the optimism.
ソラナの価格チャートを見ると、ソルは今週、主要なサポートレベルから跳ね返り、強気の回復への希望を提供しました。運動量の指標はわずかな改善を示しており、さらに楽観的になります。
The Relative Strength Index (RSI) recently crossed above its signal line, sending a buy signal, while the MACD’s histogram shows that negative momentum has decelerated.
相対強度指数(RSI)は最近、その信号線を超えて購入信号を送信し、MACDのヒストグラムは負の運動量が減速したことを示しています。
Despite these positive signals, SOL is still largely confined to a downtrend until a stronger reversal is confirmed. The chart features a descending triangle, a bearish price pattern that signals selling pressure at any price above the support level. As SOL continues to approach this support, there is a threat of further downward pressure, especially if the broader market remains pessimistic.
これらの肯定的なシグナルにもかかわらず、SOLは、より強い逆転が確認されるまで、依然として主に鈍いトレンドに限定されています。チャートには、下降する三角形が特徴です。これは、サポートレベルを超える任意の価格で販売圧力を示す弱気な価格パターンです。 Solがこのサポートにアプローチし続けるにつれて、特により広範な市場が悲観的なままである場合、さらに下向きの圧力の脅威があります。
If SOL breaks below the $100 support, it could face a 22% decline, targeting the $78 area. If global trade tensions worsen, this could push the price even lower, potentially as low as $70.
Solが100ドルのサポートを下回った場合、78ドルのエリアを対象とした22%の減少に直面する可能性があります。世界貿易の緊張が悪化した場合、これにより価格がさらに低くなる可能性があり、潜在的に70ドルという低い可能性があります。
Trading volumes around the $100 level have been relatively high, indicating a significant buildup of buy orders at this critical juncture. If sellers manage to break this level again, the market’s buying power could already be exhausted, favoring a bearish breakout.
約100ドルのレベルの取引量は比較的高く、この重要な時点での購入注文の大幅な蓄積を示しています。売り手が再びこのレベルを破ることができれば、市場の購買力はすでに使い果たされ、弱気のブレイクアウトを支持します。
If buyers can defend the $100 support, it suggests that they are still capable of pushing the price higher. However, if sellers manage to break through the $100 level again, it signals that the market's buying strength might be waning, favoring a continuation of the downtrend.
バイヤーが100ドルのサポートを守ることができる場合、価格を引き上げることができることを示唆しています。ただし、売り手が再び100ドルのレベルを突破することができた場合、市場の購入強度が衰退している可能性があり、下降トレンドの継続を支持する可能性があることを示しています。
If sellers break through the $100 support level and close a candle below it, it would be a bearish signal, indicating that sellers have gained control and are likely to continue pushing the price lower.
売り手が100ドルのサポートレベルを突破し、その下のキャンドルを閉じた場合、それは弱気なシグナルであり、売り手がコントロールを獲得し、価格を下げ続ける可能性が高いことを示します。
But if buyers manage to defend the $100 support level and close a candle above it, it would be a bullish signal, indicating that buyers are still in control and might be able to push the price higher.
しかし、バイヤーが100ドルのサポートレベルを守り、その上のろうそくを閉めることができれば、それは強気な信号であり、買い手はまだコントロールされており、価格を高くすることができるかもしれないことを示しています。
The technical indicators are also showing mixed signals. The RSI is showing signs of oversold conditions, which could lead to a short-term rebound. However, the MACD is still in negative territory, which indicates that there is more selling pressure than buying pressure.
技術指標には、混合信号も表示されています。 RSIは、売られすぎの条件の兆候を示しており、短期的なリバウンドにつながる可能性があります。ただし、MACDは依然としてネガティブな領域にあり、これは購入圧力よりも販売圧力が多いことを示しています。
Overall, the technical indicators are suggesting that the tide might be turning in favor of buyers, but the selling pressure is still strong.
全体として、技術的指標は、潮が買い手に有利になっているかもしれないことを示唆していますが、販売圧力は依然として強いです。
The direction of the global trade talks will also be a key factor to watch. If the talks break down and trade tensions escalate, this could lead to further weakness in the crypto market, which could push SOL lower. However, if the talks proceed smoothly and there are signs of a trade deal being reached, this could lead to a rally in the crypto market, which could push SOL higher.
世界貿易協議の方向性も視聴する重要な要素になります。協議が崩壊し、貿易の緊張がエスカレートすると、これは暗号市場のさらなる弱さにつながる可能性があり、それによりSolが低下する可能性があります。しかし、講演がスムーズに進行し、貿易契約に到達する兆候がある場合、これは暗号市場での集会につながる可能性があり、それがSOLをより高く押し上げる可能性があります。
In the short term, SOL
短期的には、sol
免責事項:info@kdj.com
提供される情報は取引に関するアドバイスではありません。 kdj.com は、この記事で提供される情報に基づいて行われた投資に対して一切の責任を負いません。暗号通貨は変動性が高いため、十分な調査を行った上で慎重に投資することを強くお勧めします。
このウェブサイトで使用されているコンテンツが著作権を侵害していると思われる場合は、直ちに当社 (info@kdj.com) までご連絡ください。速やかに削除させていただきます。
-

-

-

-

- トランポリンの下で草が死ぬのを防ぐ方法
- 2025-06-11 17:00:11
- LawnsmithのBen Agnewは、今年あなたの草の上で発達する大きな茶色の円を避けるのに役立つアドバイスを共有しています。
-

-

-

-

-


