-
 Bitcoin
 $107,652.0931
-2.78% -
 Ethereum
 $2,547.3569
-4.13% -
 Tether USDt
 $1.0000
0.02% -
 XRP
XRP $2.3368
-3.68% -
 BNB
BNB $668.3932
-2.05% -
 Solana
 $174.0097
-4.74% -
 USDC
USDC $0.9998
0.00% -
 Dogecoin
 $0.2274
-6.60% -
 Cardano
 $0.7576
-6.29% -
 TRON
TRON $0.2718
-0.57% -
 Sui
Sui $3.6572
-4.28% -
 Hyperliquid
 $33.7456
-3.23% -
 Chainlink
 $15.6859
-5.87% -
 Avalanche
 $23.1284
-7.86% -
 Stellar
 $0.2903
-3.58% -
 Bitcoin Cash
 $427.9140
-1.74% -
 Shiba Inu
 $0.0...01439
-6.59% -
 UNUS SED LEO
 $8.7855
-0.82% -
 Hedera
 $0.1909
-6.19% -
 Toncoin
 $3.0220
-3.63% -
 Monero
 $399.8991
2.29% -
 Litecoin
 $96.6731
-3.36% -
 Polkadot
 $4.5916
-6.75% -
 Bitget Token
 $5.5012
-5.18% -
 Pepe
Pepe $0.0...01385
-10.54% -
 Pi
Pi $0.7782
-1.54% -
 Dai
Dai $0.9998
0.01% -
 Ethena USDe
 $1.0006
0.05% -
 Aave
Aave $259.2087
1.50% -
 Uniswap
 $6.1083
-5.01%
Is MFI accurate in a volatile rising market? How to operate the volatile rising MFI?
In volatile rising markets, the MFI can be misleading; use longer timeframes and combine with RSI to confirm signals and set clear entry/exit points.
May 23, 2025 at 11:14 pm
Introduction to MFI and Volatile Rising Markets
The Money Flow Index (MFI) is a momentum indicator that measures the inflow and outflow of money into a security over a specific period. It's commonly used to identify overbought or oversold conditions in the market, which can signal potential reversals. In a volatile rising market, where prices are increasing rapidly with significant fluctuations, traders often question the accuracy of the MFI and how to effectively operate it. This article will delve into these questions, providing detailed insights and operational guidance.
Understanding MFI in Volatile Rising Markets
In a volatile rising market, the MFI can be both accurate and misleading. The accuracy of the MFI depends on several factors, including the timeframe used and the market's overall trend. In a rapidly rising market, the MFI might frequently show overbought conditions, which could lead traders to believe a reversal is imminent. However, in a strong bull market, these overbought signals might not lead to immediate reversals but rather to continued upward momentum.
Factors Affecting MFI Accuracy in Volatile Rising Markets
Several factors can influence the accuracy of the MFI in a volatile rising market:
- Timeframe: Shorter timeframes can result in more frequent overbought and oversold signals, which might not be reliable in a volatile rising market. Longer timeframes can provide more stable readings but may miss short-term opportunities.
- Volume: High trading volumes can amplify the MFI readings, making the market appear more overbought or oversold than it actually is.
- Market Sentiment: In a bullish market, traders might ignore overbought signals, leading to extended rallies despite high MFI readings.
How to Operate MFI in Volatile Rising Markets
Operating the MFI effectively in a volatile rising market requires a strategic approach. Here are detailed steps to follow:
Choose the Right Timeframe: For a volatile rising market, consider using a longer timeframe, such as daily or weekly charts, to filter out short-term noise and focus on the broader trend.
Combine with Other Indicators: Use the MFI in conjunction with other indicators, such as the Relative Strength Index (RSI) or moving averages, to confirm signals. For instance, if the MFI shows overbought conditions and the RSI is also high, it might be a stronger signal for a potential reversal.
Monitor Volume: Pay close attention to trading volumes. High volumes during upward moves can validate the MFI readings, while low volumes might suggest a lack of conviction in the trend.
Set Clear Entry and Exit Points: Establish clear entry and exit points based on MFI readings. For example, if the MFI crosses above 80, consider it overbought and look for potential exit points. Conversely, if it falls below 20, it might be oversold, and you could look for entry opportunities.
Practical Example of Operating MFI in a Volatile Rising Market
To illustrate how to operate the MFI in a volatile rising market, consider the following example:
Select a Cryptocurrency: Choose a cryptocurrency that is currently in a volatile rising market, such as Bitcoin during a bull run.
Set Up Your Chart: Open a trading platform and set up a daily chart for Bitcoin. Add the MFI indicator with a default setting of 14 periods.
Analyze the MFI:
- If the MFI crosses above 80, it indicates overbought conditions. In a volatile rising market, this might not immediately signal a reversal but could suggest caution.
- If the MFI falls below 20, it indicates oversold conditions, which might be a buying opportunity if other indicators confirm the signal.
Confirm with Other Indicators:
- Check the RSI. If it's also high (above 70), it might reinforce the overbought signal from the MFI.
- Look at moving averages. If the price is far above a long-term moving average, it could indicate that the market is due for a correction.
Execute Trades:
- If the MFI and RSI are both overbought, consider taking profits or setting a stop-loss to protect gains.
- If the MFI and RSI are both oversold, consider entering a long position, especially if the price is near a significant support level.
Adjusting MFI Settings for Volatile Rising Markets
In volatile rising markets, adjusting the MFI settings can help improve its accuracy:
- Period Length: Increase the period length from the standard 14 to 20 or 25 to smooth out the MFI readings and reduce false signals.
- Overbought/Oversold Levels: Consider adjusting the overbought level from 80 to 85 and the oversold level from 20 to 15 to account for the extended rallies in a volatile rising market.
Frequently Asked Questions
Q: Can the MFI be used effectively in all types of markets?
A: While the MFI is versatile, its effectiveness varies across different market conditions. In stable, trending markets, the MFI can be highly accurate. However, in choppy or sideways markets, it might generate many false signals. In volatile rising markets, as discussed, it requires careful interpretation and combination with other indicators.
Q: How does the MFI differ from other momentum indicators like the RSI?
A: The MFI and RSI both measure momentum, but they do so differently. The MFI incorporates volume into its calculation, making it a volume-weighted RSI. This means the MFI can provide insights into the strength of a price move based on trading volume, which the RSI does not consider.
Q: Is it possible to use the MFI for short-term trading in a volatile rising market?
A: Yes, but it requires a more nuanced approach. For short-term trading, consider using a shorter timeframe, such as hourly charts, and be prepared for more frequent signals. Combine the MFI with other short-term indicators and be ready to act quickly on signals, as the market can change rapidly.
Q: Can the MFI predict market reversals accurately in a volatile rising market?
A: While the MFI can indicate overbought or oversold conditions that might precede a reversal, it is not a perfect predictor. In a volatile rising market, overbought signals might persist longer than expected. Therefore, it's crucial to use the MFI in conjunction with other indicators and market analysis to increase the likelihood of accurately predicting reversals.
Disclaimer:info@kdj.com
The information provided is not trading advice. kdj.com does not assume any responsibility for any investments made based on the information provided in this article. Cryptocurrencies are highly volatile and it is highly recommended that you invest with caution after thorough research!
If you believe that the content used on this website infringes your copyright, please contact us immediately (info@kdj.com) and we will delete it promptly.
- Polygon (MATIC) Co-Founder Mihailo Bjelic Steps Away from Project After Seven Years
- 2025-05-24 15:30:13
- Troller Cat ($TCAT) Is the Top Meme Coin to Buy and Hold Right Now
- 2025-05-24 15:30:13
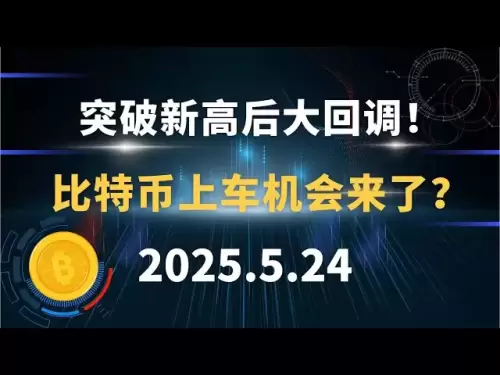
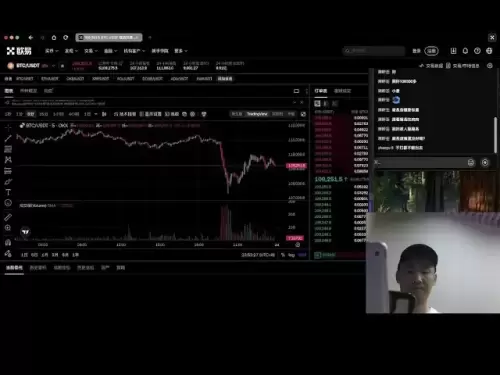
- Just a day after Bitcoin reached its all-time high, another piece of news arrived that caused a pullback.
- 2025-05-24 15:25:13
- Shiba Inu (SHIB) Loses Ground to BONK and Lightchain AI
- 2025-05-24 15:25:13
- Bitcoin (BTC) – Eyes Set on ATH, But Volatility Remains
- 2025-05-24 15:20:19
- Crypto Expert Warns of Potential Exhaustion in Meme Coin Rally
- 2025-05-24 15:20:19
Related knowledge
How to use EMV when the stock price rises continuously? How to avoid misjudgment in extreme market conditions?
May 23,2025 at 07:29pm
In the dynamic world of cryptocurrency trading, the Exponential Moving Average (EMA) is a powerful tool that traders use to make informed decisions, especially during periods of continuous stock price rises. Understanding how to effectively use EMAs and avoiding misjudgment in extreme market conditions are crucial skills for any crypto trader. This arti...
Does EMV have any signs before a consolidation breakthrough? When will the indicator give an early warning?
May 23,2025 at 06:42pm
Does EMV have any signs before a consolidation breakthrough? When will the indicator give an early warning? The Ease of Movement Value (EMV) is a technical indicator that helps traders understand the relationship between price and volume in the cryptocurrency market. It is particularly useful for identifying potential breakouts from consolidation period...
Is EMV effective in cryptocurrencies? Do parameters need to be adjusted in a high volatility environment?
May 24,2025 at 01:49am
Is EMV effective in cryptocurrencies? Do parameters need to be adjusted in a high volatility environment? EMV, or Ease of Movement Value, is a technical indicator that measures the relationship between price changes and volume. Originally developed for traditional financial markets, its application in the cryptocurrency space raises several questions ab...
How to use EMV in the options market? Does volatility have a big impact on indicators?
May 24,2025 at 07:28am
How to Use EMV in the Options Market? Does Volatility Have a Big Impact on Indicators? The Ease of Movement Value (EMV) is a technical indicator that helps traders understand the relationship between price and volume, and it can be particularly useful in the options market. In this article, we will explore how to use EMV in the options market and examin...
How to read EMV when the volume breaks through? Is the signal stronger when the volume and price cooperate?
May 24,2025 at 02:14pm
Understanding how to read EMV (Ease of Movement) when volume breaks through and assessing the strength of signals when volume and price cooperate are crucial skills for cryptocurrency traders. This article will delve into these topics, providing detailed insights and practical guidance. What is EMV and Its Importance in Cryptocurrency Trading?EMV, or Ea...
How do EMV and Bollinger Bands work together? Are signals near the upper and lower rails more reliable?
May 24,2025 at 02:49pm
The integration of Exponential Moving Average (EMV) and Bollinger Bands in cryptocurrency trading offers a powerful tool for traders looking to enhance their decision-making process. Both indicators, when used together, can provide a more comprehensive view of market trends and potential entry and exit points. This article will explore how EMV and Bolli...

How to use EMV when the stock price rises continuously? How to avoid misjudgment in extreme market conditions?
May 23,2025 at 07:29pm
In the dynamic world of cryptocurrency trading, the Exponential Moving Average (EMA) is a powerful tool that traders use to make informed decisions, especially during periods of continuous stock price rises. Understanding how to effectively use EMAs and avoiding misjudgment in extreme market conditions are crucial skills for any crypto trader. This arti...

Does EMV have any signs before a consolidation breakthrough? When will the indicator give an early warning?
May 23,2025 at 06:42pm
Does EMV have any signs before a consolidation breakthrough? When will the indicator give an early warning? The Ease of Movement Value (EMV) is a technical indicator that helps traders understand the relationship between price and volume in the cryptocurrency market. It is particularly useful for identifying potential breakouts from consolidation period...

Is EMV effective in cryptocurrencies? Do parameters need to be adjusted in a high volatility environment?
May 24,2025 at 01:49am
Is EMV effective in cryptocurrencies? Do parameters need to be adjusted in a high volatility environment? EMV, or Ease of Movement Value, is a technical indicator that measures the relationship between price changes and volume. Originally developed for traditional financial markets, its application in the cryptocurrency space raises several questions ab...

How to use EMV in the options market? Does volatility have a big impact on indicators?
May 24,2025 at 07:28am
How to Use EMV in the Options Market? Does Volatility Have a Big Impact on Indicators? The Ease of Movement Value (EMV) is a technical indicator that helps traders understand the relationship between price and volume, and it can be particularly useful in the options market. In this article, we will explore how to use EMV in the options market and examin...

How to read EMV when the volume breaks through? Is the signal stronger when the volume and price cooperate?
May 24,2025 at 02:14pm
Understanding how to read EMV (Ease of Movement) when volume breaks through and assessing the strength of signals when volume and price cooperate are crucial skills for cryptocurrency traders. This article will delve into these topics, providing detailed insights and practical guidance. What is EMV and Its Importance in Cryptocurrency Trading?EMV, or Ea...

How do EMV and Bollinger Bands work together? Are signals near the upper and lower rails more reliable?
May 24,2025 at 02:49pm
The integration of Exponential Moving Average (EMV) and Bollinger Bands in cryptocurrency trading offers a powerful tool for traders looking to enhance their decision-making process. Both indicators, when used together, can provide a more comprehensive view of market trends and potential entry and exit points. This article will explore how EMV and Bolli...
See all articles


