-
 Bitcoin
 $101,898.5005
-0.75% -
 Ethereum
 $2,258.1125
-1.07% -
 Tether USDt
 $1.0004
0.01% -
 XRP
XRP $2.0178
-2.93% -
 BNB
BNB $624.0243
-1.53% -
 Solana
 $134.3298
-0.90% -
 USDC
USDC $0.9999
0.01% -
 TRON
TRON $0.2675
-2.05% -
 Dogecoin
 $0.1538
-1.96% -
 Cardano
 $0.5482
-1.11% -
 Hyperliquid
 $35.5636
5.45% -
 Bitcoin Cash
 $453.4902
-1.66% -
 Sui
Sui $2.5134
-2.97% -
 UNUS SED LEO
 $9.1292
1.77% -
 Chainlink
 $11.8457
-1.60% -
 Stellar
 $0.2312
-2.73% -
 Avalanche
 $16.9721
0.29% -
 Toncoin
 $2.7549
-3.82% -
 Shiba Inu
 $0.0...01081
-1.10% -
 Litecoin
 $80.8250
-0.71% -
 Hedera
 $0.1374
0.21% -
 Monero
 $305.4827
-2.36% -
 Ethena USDe
 $1.0006
0.00% -
 Dai
Dai $1.0000
-0.01% -
 Polkadot
 $3.2085
-3.12% -
 Bitget Token
 $4.0845
-3.13% -
 Uniswap
 $6.3353
-1.63% -
 Pi
Pi $0.5085
-0.70% -
 Pepe
Pepe $0.0...08913
-3.82% -
 Aave
Aave $232.7090
-0.58%
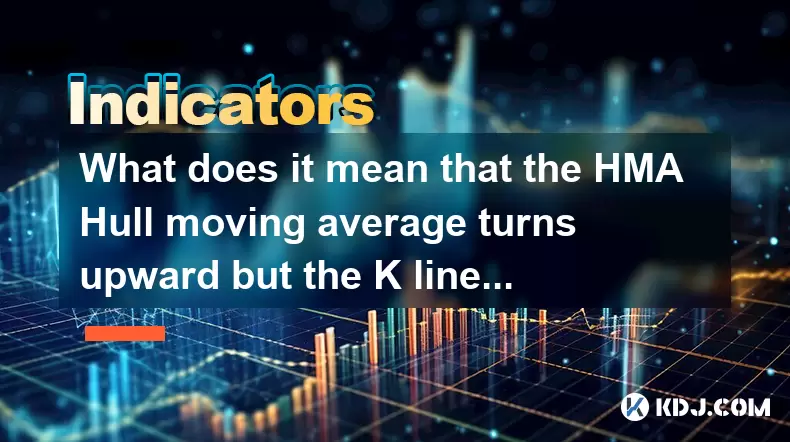
What does it mean that the HMA Hull moving average turns upward but the K line does not follow? Is it a false breakthrough?
When the HMA turns upward but the K line remains flat or declines, it signals potential divergence, suggesting weak buying pressure despite bullish momentum.
Jun 23, 2025 at 11:14 am
Understanding the HMA Hull Moving Average
The Hull Moving Average (HMA) is a type of technical indicator designed to reduce lag and provide smoother price signals compared to traditional moving averages like the Simple Moving Average (SMA) or Exponential Moving Average (EMA). Developed by Alan Hull, this indicator calculates weighted averages across different periods and then applies a square root of the period to further smooth the data. When the HMA turns upward, it typically suggests that short-term momentum may be shifting in favor of buyers.
In the context of cryptocurrency trading, where volatility can lead to rapid trend reversals, the HMA turning upward often acts as an early signal for traders to consider entering long positions or closing shorts. However, this signal gains credibility only when corroborated by other indicators or price action. If the K line (price bar or candlestick) does not follow the direction indicated by the HMA, it raises concerns about the validity of the signal.
What Is the K Line and Why Does It Matter?
The K line, commonly known as the candlestick chart, visually represents the open, high, low, and close prices over a specific time frame. Each candlestick tells a story about market sentiment — whether bulls or bears are in control. In crypto markets, where emotional trading is common, candlesticks can often mislead inexperienced traders due to sudden spikes or fakeouts.
When the HMA turns upward but the K line remains flat or declines, it creates a divergence between the momentum signal and actual price behavior. This mismatch may suggest that although the average price movement appears bullish, real-time buying pressure is insufficient to push the price higher. Traders should interpret this situation with caution, especially if volume also fails to confirm the HMA's positive shift.
Why the Discrepancy Occurs: Divergence Between Indicators
Divergence occurs when two indicators or an indicator and price move in opposite directions. In this case, the HMA indicates a potential bullish trend, while the K line shows no corresponding rise in price. Several reasons might explain this phenomenon:
- The momentum behind the uptrend is weak, meaning there isn't enough buying activity to sustain higher prices.
- Market participants might be taking profits or selling into strength, which prevents the price from rising despite improved average readings.
- Short-term traders using algorithmic systems could be manipulating the HMA reading without affecting the actual candlestick pattern significantly.
This kind of divergence is not uncommon in highly volatile assets like cryptocurrencies. For example, Bitcoin or Ethereum may show a temporary upward tilt in the HMA during consolidation phases, even though the broader market remains range-bound.
Is It a False Breakout or Fake Signal?
A false breakout, sometimes called a fake signal, happens when the price moves above or below a key level but quickly reverses, trapping traders who entered based on that move. Similarly, if the HMA turns upward prematurely, and the K line doesn’t confirm, it can act like a false breakout in terms of misleading traders.
Here’s how to assess whether it’s a false signal:
- Check the volume accompanying the HMA shift. If volume is low, the move lacks conviction.
- Look at support/resistance levels nearby. If the price is approaching a strong resistance zone and the HMA turns up but the K line stalls, it may indicate rejection.
- Observe other confirming indicators, such as RSI or MACD. If they don’t align with the HMA, the likelihood of a false signal increases.
In fast-moving crypto pairs like ETH/USDT or SOL/USD, these false signals can occur frequently, especially during sideways markets or ahead of major news events.
How to Trade This Scenario: Practical Steps
If you observe the HMA turning upward but the K line not following, here are actionable steps to take:
- Do not enter trades solely based on HMA movement. Wait for confirmation from other tools or candlestick patterns.
- Use trendlines or support/resistance zones to determine whether the price is likely to break out or reverse.
- Monitor trading volume closely. A genuine breakout usually comes with increased volume.
- Consider placing stop-loss orders below recent swing lows if you decide to trade based on delayed confirmation.
- Combine HMA with oscillators like RSI or Stochastic to filter out false signals and avoid premature entries.
For instance, if BTC/USDT shows a rising HMA but the K line continues forming bearish candles near a critical resistance level, it might be wise to hold off until a clear breakout or reversal candlestick appears.
Frequently Asked Questions
Q1: Can the HMA be used alone for trading decisions in crypto markets?
No, the HMA should not be used in isolation. It works best when combined with volume analysis, candlestick patterns, and other indicators like RSI or MACD to increase accuracy and avoid false signals.
Q2: How does the HMA differ from EMA or SMA in detecting trend changes?
The HMA reduces lag more effectively than EMA or SMA by applying a weighted calculation and smoothing mechanism. This allows it to react faster to price changes, making it more responsive in volatile crypto markets.
Q3: What timeframe is best suited for analyzing HMA and K line divergence?
Shorter timeframes like 5-minute or 15-minute charts can produce more noise, while 1-hour and 4-hour charts tend to offer clearer divergence signals. Day traders may prefer 15-minute intervals, whereas swing traders rely on 4-hour or daily charts.
Q4: How can I visually identify divergence between HMA and K line?
Plot the HMA on your chart alongside the candlesticks. Watch for instances where the HMA starts rising or falling independently of the K line. Using color-coded HMA lines (e.g., green for rising, red for falling) can help spot divergence more easily.
Disclaimer:info@kdj.com
The information provided is not trading advice. kdj.com does not assume any responsibility for any investments made based on the information provided in this article. Cryptocurrencies are highly volatile and it is highly recommended that you invest with caution after thorough research!
If you believe that the content used on this website infringes your copyright, please contact us immediately (info@kdj.com) and we will delete it promptly.
- BNB Price Check: Stablecoin Surge vs. Prediction Rollercoaster
- 2025-06-23 14:25:12
- Metaplanet's Bitcoin Bonanza: Holdings Skyrocket Amidst Market Swings
- 2025-06-23 14:25:12
- Global Meltdown, Investors, and Safe Havens: Navigating the Storm
- 2025-06-23 14:30:12
- NFT Sales Snapshot: Guild of Heroes, Polygon, and the Market's Shifting Sands
- 2025-06-23 15:25:12
- AVAX Support Holds, Eyes Potential Surge: What's Next?
- 2025-06-23 15:11:16
- Cointelegraph Under Fire: Exploits, Phishing, and the Crypto Media Minefield
- 2025-06-23 15:11:16
Related knowledge
How to read the sideways consolidation after the bottom volume and long positive line?
Jun 23,2025 at 02:28pm
Understanding the Sideways ConsolidationWhen analyzing cryptocurrency charts, sidewards consolidation refers to a phase where prices move within a narrow range without a clear upward or downward trend. This pattern often appears after significant price movements, such as a sharp increase followed by a period of equilibrium between buyers and sellers. In...
How to calculate the target position after the daily limit breaks through the previous high?
Jun 23,2025 at 02:57pm
Understanding the Daily Limit BreakthroughIn cryptocurrency trading, a daily limit typically refers to the maximum price movement allowed within a single trading day on certain exchanges. When this limit is breached, especially when it surpasses the previous high, traders often seek to calculate the target position or expected price movement following s...
Is it effective to support the average price line of the time-sharing chart multiple times?
Jun 23,2025 at 01:36pm
Understanding the Average Price Line in Time-Sharing ChartsIn cryptocurrency trading, time-sharing charts refer to real-time price charts that display price movements over short intervals, often within a single trading day. Within these charts, the average price line, also known as the Volume Weighted Average Price (VWAP), is a commonly used technical i...
The positive line with large volume the next day of the low-level inverted hammer line confirms the reversal?
Jun 23,2025 at 01:21pm
Understanding the Low-Level Inverted Hammer LineThe inverted hammer line is a single candlestick pattern that typically appears at the end of a downtrend. It has a small real body near the bottom of the trading range and a long upper shadow, indicating that bulls attempted to push prices higher but were met with selling pressure. When this pattern forms...
What does it mean that the middle track of the Bollinger band changes from pressure to support?
Jun 23,2025 at 03:01pm
Understanding the Bollinger Band StructureThe Bollinger Bands are a technical analysis tool used in cryptocurrency trading, developed by John Bollinger. They consist of three lines: a simple moving average (SMA) in the middle and two standard deviation bands above and below it. The middle track is typically set at 20 periods and serves as a baseline for...
Is the high-level cross star accompanied by shrinking volume a warning signal of peaking?
Jun 23,2025 at 01:28pm
Understanding High-Level Cross Star PatternsIn the world of cryptocurrency trading, candlestick patterns are essential tools for technical analysis. One such pattern is the high-level cross star, which appears as a doji or near-doji candle at a significant resistance level. This pattern often indicates indecision in the market and can be interpreted as ...

How to read the sideways consolidation after the bottom volume and long positive line?
Jun 23,2025 at 02:28pm
Understanding the Sideways ConsolidationWhen analyzing cryptocurrency charts, sidewards consolidation refers to a phase where prices move within a narrow range without a clear upward or downward trend. This pattern often appears after significant price movements, such as a sharp increase followed by a period of equilibrium between buyers and sellers. In...

How to calculate the target position after the daily limit breaks through the previous high?
Jun 23,2025 at 02:57pm
Understanding the Daily Limit BreakthroughIn cryptocurrency trading, a daily limit typically refers to the maximum price movement allowed within a single trading day on certain exchanges. When this limit is breached, especially when it surpasses the previous high, traders often seek to calculate the target position or expected price movement following s...

Is it effective to support the average price line of the time-sharing chart multiple times?
Jun 23,2025 at 01:36pm
Understanding the Average Price Line in Time-Sharing ChartsIn cryptocurrency trading, time-sharing charts refer to real-time price charts that display price movements over short intervals, often within a single trading day. Within these charts, the average price line, also known as the Volume Weighted Average Price (VWAP), is a commonly used technical i...

The positive line with large volume the next day of the low-level inverted hammer line confirms the reversal?
Jun 23,2025 at 01:21pm
Understanding the Low-Level Inverted Hammer LineThe inverted hammer line is a single candlestick pattern that typically appears at the end of a downtrend. It has a small real body near the bottom of the trading range and a long upper shadow, indicating that bulls attempted to push prices higher but were met with selling pressure. When this pattern forms...

What does it mean that the middle track of the Bollinger band changes from pressure to support?
Jun 23,2025 at 03:01pm
Understanding the Bollinger Band StructureThe Bollinger Bands are a technical analysis tool used in cryptocurrency trading, developed by John Bollinger. They consist of three lines: a simple moving average (SMA) in the middle and two standard deviation bands above and below it. The middle track is typically set at 20 periods and serves as a baseline for...

Is the high-level cross star accompanied by shrinking volume a warning signal of peaking?
Jun 23,2025 at 01:28pm
Understanding High-Level Cross Star PatternsIn the world of cryptocurrency trading, candlestick patterns are essential tools for technical analysis. One such pattern is the high-level cross star, which appears as a doji or near-doji candle at a significant resistance level. This pattern often indicates indecision in the market and can be interpreted as ...
See all articles


