-
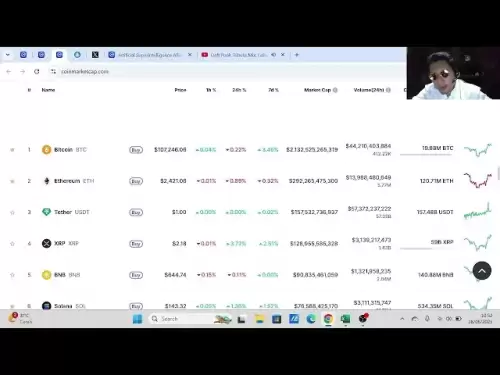
 Bitcoin
 $107,352.1067
0.28% -
 Ethereum
 $2,429.3531
-0.90% -
 Tether USDt
 $1.0001
-0.02% -
 XRP
XRP $2.1894
4.62% -
 BNB
BNB $646.7968
0.36% -
 Solana
 $147.4290
4.03% -
 USDC
USDC $0.9998
-0.02% -
 TRON
TRON $0.2756
1.52% -
 Dogecoin
 $0.1630
1.14% -
 Cardano
 $0.5612
1.18% -
 Hyperliquid
 $37.0580
-0.05% -
 Bitcoin Cash
 $496.9410
-0.09% -
 Sui
Sui $2.7318
3.19% -
 Chainlink
 $13.1503
0.58% -
 UNUS SED LEO
 $9.0766
0.55% -
 Avalanche
 $17.7220
1.46% -
 Stellar
 $0.2380
1.52% -
 Toncoin
 $2.8439
0.38% -
 Shiba Inu
 $0.0...01143
1.84% -
 Litecoin
 $85.8053
1.47% -
 Hedera
 $0.1483
2.70% -
 Monero
 $314.3240
2.12% -
 Bitget Token
 $4.6725
0.77% -
 Dai
Dai $1.0000
0.00% -
 Polkadot
 $3.3555
1.28% -
 Ethena USDe
 $1.0001
0.02% -
 Uniswap
 $7.0890
2.64% -
 Pi
Pi $0.5355
-3.40% -
 Pepe
Pepe $0.0...09393
1.06% -
 Aave
Aave $256.8136
-1.90%
What does it mean if a cross star with a small volume appears in an upward trend?
A cross star with small volume during an uptrend suggests market indecision and possible weakening bullish momentum, but confirmation is needed before acting.
Jun 28, 2025 at 11:14 am
Understanding the Cross Star Pattern
In technical analysis, a cross star refers to a candlestick pattern characterized by a small real body located in the middle of the price range, with both upper and lower shadows. This pattern often indicates indecision or a potential reversal in the market. When it appears during an upward trend, traders pay close attention as it may signal that the bullish momentum is weakening.
The key features of a cross star include:
- A small body where the open and close prices are nearly equal.
- Long upper and lower wicks, showing significant price movement during the session.
- The absence of strong buying or selling pressure.
Cross stars are neutral patterns on their own but gain significance when analyzed within the context of price trends.
Interpreting the Small Volume Context
Volume plays a crucial role in confirming the implications of any candlestick pattern. In this case, a cross star with small volume suggests that even though there was price indecision, very few participants were actively trading or committing capital. This can indicate a lack of conviction among traders about continuing the current trend.
When volume is low:
- It reflects minimal participation from institutional players.
- It may imply that the hesitation shown in the cross star is not backed by strong selling pressure.
- It could also suggest that traders are waiting for more information before making decisions.
A cross star accompanied by small volume may point to a temporary pause rather than a definitive reversal.
Identifying Market Psychology Behind the Pattern
Market psychology is essential in understanding why such a pattern forms during an uptrend. After a sustained rally, buyers typically dominate the market. However, the appearance of a cross star with small volume can indicate that buyers are becoming hesitant, possibly due to profit-taking or uncertainty about further gains.
Key psychological factors include:
- Sellers stepping in briefly but without enough force to reverse the trend.
- Traders locking in profits after a long upward move.
- Potential exhaustion of buying interest at higher levels.
This candlestick pattern reveals a tug-of-war between bulls and bears, especially when seen after a strong rally.
How to Analyze the Pattern in Cryptocurrency Charts
In cryptocurrency markets, which are known for high volatility and emotional trading, recognizing and interpreting candlestick patterns like the cross star becomes even more critical. Here’s how you can analyze this setup step-by-step:
- Look for a clear uptrend on the chart (at least three consecutive green candles).
- Locate a candle with a small body and roughly equal opening and closing prices.
- Ensure that both upper and lower shadows are significantly longer than the body.
- Check the corresponding volume bar — it should be noticeably lower than previous candles.
- Observe what happens after the cross star: does the price continue up, or does it drop?
It's important to wait for confirmation after the cross star candle closes to avoid false signals.
What Should Traders Do After Seeing This Pattern?
Traders should not act immediately upon seeing a cross star with low volume. Instead, they should monitor the next few candles to see whether the uptrend resumes or if a reversal begins.
Possible actions include:
- Placing a stop-loss order just below the cross star's low if holding a long position.
- Waiting for a bearish candle to confirm the possible trend reversal.
- Watching for increased volume on the next candle — rising volume on a down day strengthens the reversal signal.
- Using other indicators like RSI or MACD to validate the potential change in direction.
Patience and additional confirmation are key to avoiding premature exits or entries based solely on this pattern.
Frequently Asked Questions
Q: Is a cross star always a reversal pattern?
No, a cross star is not always a reversal pattern. It primarily indicates indecision and requires context — such as its placement in a trend and accompanying volume — to determine whether a reversal is likely.
Q: Can I trade based only on a cross star with small volume?
It's generally not recommended to base trades solely on one candlestick pattern. Always combine it with other tools like support/resistance levels, moving averages, or volume analysis for better accuracy.
Q: What timeframes are most reliable for analyzing this pattern?
Higher timeframes like 4-hour or daily charts tend to offer more reliable signals compared to shorter ones. Lower timeframes can generate many false positives due to increased noise and volatility.
Q: How does this pattern differ from a doji?
While both have small bodies and show indecision, a classic doji has equal open and close prices. A cross star may have a slightly larger body but still conveys similar uncertainty. Both require confirmation and context to be meaningful.
Disclaimer:info@kdj.com
The information provided is not trading advice. kdj.com does not assume any responsibility for any investments made based on the information provided in this article. Cryptocurrencies are highly volatile and it is highly recommended that you invest with caution after thorough research!
If you believe that the content used on this website infringes your copyright, please contact us immediately (info@kdj.com) and we will delete it promptly.
- Pi2Day Disappointment: Why the Pi Network Community Is Losing Faith
- 2025-06-28 18:30:12
- Silver Lining: Robert Kiyosaki's July 2025 Silver Prediction
- 2025-06-28 18:30:12
- Gotta Go Fast! Sonic Speeds into Magic: The Gathering Secret Lair
- 2025-06-28 18:50:12
- Bitcoin Price Swings: Navigating Volatility and Predicting the Future
- 2025-06-28 19:10:14
- Meme Coins in 2025: Will Shiba Inu Make a Comeback?
- 2025-06-28 19:30:12
- Pi Network's AI App Studio and Staking Utility: Revolution or Red Herring?
- 2025-06-28 19:30:12
Related knowledge
Should I go if the average price line of the time-sharing chart suppresses the rebound?
Jun 28,2025 at 05:14pm
Understanding the Time-Sharing Chart and Average Price LineThe time-sharing chart is a real-time chart used in cryptocurrency trading to visualize price movements over short intervals, typically within a single trading day. It provides traders with insights into intraday volatility and momentum. The average price line, often calculated as a moving avera...
Can I add positions after the EXPMA golden cross steps back on the yellow line?
Jun 28,2025 at 11:57am
Understanding the EXPMA Indicator and Its RelevanceThe EXPMA (Exponential Moving Average) is a technical analysis tool used by traders to identify trends and potential entry or exit points in financial markets, including cryptocurrency trading. Unlike simple moving averages, EXPMA gives more weight to recent price data, making it more responsive to new ...
How to operate the next day after the daily limit is released with huge volume?
Jun 28,2025 at 12:35pm
Understanding the Daily Limit and Its ReleaseIn cryptocurrency trading, daily limits are often set by exchanges to manage volatility or during periods of high market activity. These limits can restrict how much an asset's price can fluctuate within a 24-hour period. When the daily limit is released, it typically means that the price cap has been lifted,...
Is it necessary to stop loss when the lower track of the rising channel falls below?
Jun 28,2025 at 05:29pm
Understanding the Rising Channel PatternThe rising channel pattern is a popular technical analysis tool used by traders to identify potential upward trends in asset prices. It consists of two parallel lines: an upper resistance line and a lower support line, both sloping upwards. The price action typically oscillates between these boundaries, offering o...
Can I chase after the W bottom neckline breaks through with large volume?
Jun 28,2025 at 07:28am
Understanding the W Bottom Pattern in Cryptocurrency TradingThe W bottom pattern is a common technical analysis formation used by traders to identify potential bullish reversals. In cryptocurrency markets, this pattern typically appears after a downtrend and signals that the selling pressure may be diminishing. The structure of the W bottom includes two...
Is it effective if the gap is not filled for three days?
Jun 28,2025 at 01:00pm
Understanding Gaps in Cryptocurrency MarketsIn the context of cryptocurrency trading, a gap refers to a situation where the price of an asset opens significantly higher or lower than its previous closing price, with no trading activity occurring in between. These gaps are commonly observed during periods of high volatility, especially when major news ev...

Should I go if the average price line of the time-sharing chart suppresses the rebound?
Jun 28,2025 at 05:14pm
Understanding the Time-Sharing Chart and Average Price LineThe time-sharing chart is a real-time chart used in cryptocurrency trading to visualize price movements over short intervals, typically within a single trading day. It provides traders with insights into intraday volatility and momentum. The average price line, often calculated as a moving avera...

Can I add positions after the EXPMA golden cross steps back on the yellow line?
Jun 28,2025 at 11:57am
Understanding the EXPMA Indicator and Its RelevanceThe EXPMA (Exponential Moving Average) is a technical analysis tool used by traders to identify trends and potential entry or exit points in financial markets, including cryptocurrency trading. Unlike simple moving averages, EXPMA gives more weight to recent price data, making it more responsive to new ...

How to operate the next day after the daily limit is released with huge volume?
Jun 28,2025 at 12:35pm
Understanding the Daily Limit and Its ReleaseIn cryptocurrency trading, daily limits are often set by exchanges to manage volatility or during periods of high market activity. These limits can restrict how much an asset's price can fluctuate within a 24-hour period. When the daily limit is released, it typically means that the price cap has been lifted,...

Is it necessary to stop loss when the lower track of the rising channel falls below?
Jun 28,2025 at 05:29pm
Understanding the Rising Channel PatternThe rising channel pattern is a popular technical analysis tool used by traders to identify potential upward trends in asset prices. It consists of two parallel lines: an upper resistance line and a lower support line, both sloping upwards. The price action typically oscillates between these boundaries, offering o...

Can I chase after the W bottom neckline breaks through with large volume?
Jun 28,2025 at 07:28am
Understanding the W Bottom Pattern in Cryptocurrency TradingThe W bottom pattern is a common technical analysis formation used by traders to identify potential bullish reversals. In cryptocurrency markets, this pattern typically appears after a downtrend and signals that the selling pressure may be diminishing. The structure of the W bottom includes two...

Is it effective if the gap is not filled for three days?
Jun 28,2025 at 01:00pm
Understanding Gaps in Cryptocurrency MarketsIn the context of cryptocurrency trading, a gap refers to a situation where the price of an asset opens significantly higher or lower than its previous closing price, with no trading activity occurring in between. These gaps are commonly observed during periods of high volatility, especially when major news ev...
See all articles


