-
 Bitcoin
 $107,467.9126
1.26% -
 Ethereum
 $2,447.5288
-0.12% -
 Tether USDt
 $1.0005
0.00% -
 XRP
XRP $2.1921
0.13% -
 BNB
BNB $647.2897
0.50% -
 Solana
 $144.8627
-0.37% -
 USDC
USDC $0.9996
-0.03% -
 TRON
TRON $0.2732
0.10% -
 Dogecoin
 $0.1652
-0.18% -
 Cardano
 $0.5700
-2.87% -
 Hyperliquid
 $37.0274
-1.81% -
 Bitcoin Cash
 $484.6957
0.19% -
 Sui
Sui $2.7354
-2.19% -
 Chainlink
 $13.1727
-1.49% -
 UNUS SED LEO
 $8.9978
-0.04% -
 Stellar
 $0.2421
-2.33% -
 Avalanche
 $17.5633
-3.51% -
 Toncoin
 $2.8476
-1.94% -
 Shiba Inu
 $0.0...01166
-0.56% -
 Litecoin
 $85.1071
0.09% -
 Hedera
 $0.1502
-2.96% -
 Monero
 $310.2774
-1.64% -
 Dai
Dai $0.9999
-0.01% -
 Polkadot
 $3.3584
-1.88% -
 Ethena USDe
 $1.0003
-0.04% -
 Bitget Token
 $4.4443
2.90% -
 Pi
Pi $0.6242
14.04% -
 Uniswap
 $6.9774
-2.86% -
 Pepe
Pepe $0.0...09535
-5.05% -
 Aave
Aave $256.7574
-3.35%
When should we be alert to the continuous positive lines with large volume at low levels?
Bullish candles with high volume at low prices may signal accumulation or a potential trend reversal, but traders should confirm with resistance breaks and key indicators before acting.
Jun 16, 2025 at 10:56 pm
Understanding Continuous Positive Lines in Cryptocurrency Charts
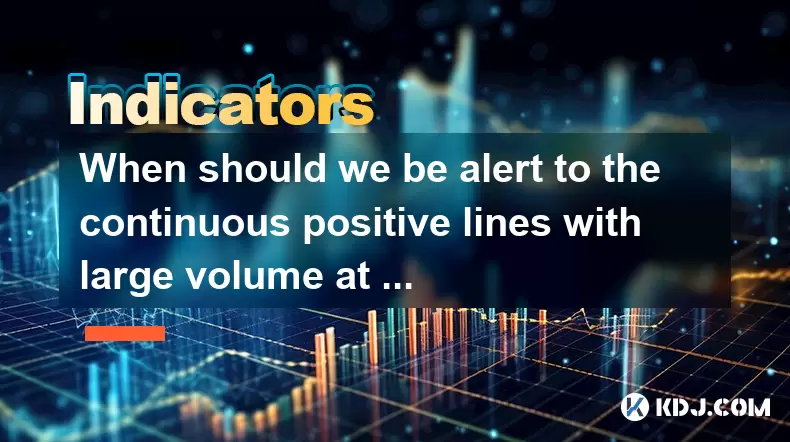
In the world of cryptocurrency trading, chart patterns are essential tools for predicting price movements. One such pattern that traders often observe is a series of continuous positive lines—also known as bullish candles—appearing at low price levels. These lines, especially when accompanied by large volume, can signal potential market shifts. However, they also raise critical questions: What do these patterns mean? When should traders be cautious?
Continuous positive lines with large volume at low levels typically indicate strong buying pressure despite the asset being undervalued or oversold. This could suggest accumulation by institutional players or whales who believe the price has reached a support level.
What Does It Mean When Volume Is High During Low-Price Bullish Candles?
High volume during bullish candlesticks at low prices suggests that buyers are stepping in aggressively. In crypto markets, where volatility reigns supreme, this kind of activity may hint at a reversal from a downtrend to an uptrend.
- Accumulation phase: Smart money may begin accumulating assets at discounted prices.
- Market sentiment shift: A sudden surge in volume can reflect changing investor perception about the project or broader market conditions.
- Technical bounce: Oversold conditions on indicators like RSI or MACD might trigger short-term rebounds.
However, high volume alone doesn't guarantee a reversal. Sometimes, it could be a trap set by manipulators to lure retail traders into false breakouts.
When Should Traders Be Alert to This Pattern?
Traders must pay attention to several key signals before interpreting this pattern as a genuine opportunity or warning sign.
- Confluence with support levels: If the price is near a historical support zone and shows multiple green candles with rising volume, it increases the reliability of the signal.
- Timeframe alignment: A pattern seen on a daily chart is more significant than one observed on a 1-hour chart.
- Volume comparison: The volume should significantly exceed the average volume of previous sessions to be considered meaningful.
Additionally, if the pattern appears after a prolonged downtrend without any major news catalyst, it's likely a temporary relief rally rather than a full-fledged trend change.
How Can We Differentiate Between Genuine Reversals and False Signals?
Identifying whether the continuous positive lines are part of a real reversal or just noise requires technical confirmation.
- Break above resistance: A close above a key resistance level confirms the strength behind the bullish movement.
- Candlestick confirmation: Look for strong continuation candles like engulfing patterns or hammer formations following the initial green lines.
- Moving averages: A cross above the 50-day or 200-day moving average adds credibility to the reversal.
Failure to confirm with these additional indicators increases the risk of entering a trade based on misleading data.
What Risks Are Associated With Acting on This Signal Prematurely?
Jumping into a position solely because of bullish candles and high volume at low levels can expose traders to substantial risks.
- Whale manipulation: Large holders may create artificial demand to entice buyers before dumping their holdings.
- Short squeezes: A rapid rise in price due to shorts covering positions can quickly reverse once the momentum fades.
- Lack of fundamentals: If the underlying project lacks solid development, partnerships, or utility, the rally may not last long.
Therefore, relying only on technical signs without considering the broader context can lead to costly mistakes.
Frequently Asked Questions
Q: How many consecutive positive lines are needed to consider this pattern significant?
There’s no fixed number, but generally, seeing three or more consecutive bullish candles with increasing volume at key support levels is considered a stronger signal. However, always check for other confirming indicators.
Q: Can this pattern appear in altcoins differently compared to Bitcoin or Ethereum?
Yes. Altcoins often experience more volatile swings, so this pattern might be less reliable unless supported by fundamental developments or sector-specific news.
Q: Is there a specific indicator that works best alongside this pattern?
Combining volume analysis with tools like the Relative Strength Index (RSI), Moving Average Convergence Divergence (MACD), and Bollinger Bands can provide better clarity about overbought/oversold conditions and trend strength.
Q: Should I use stop-loss orders when trading based on this pattern?
Absolutely. Since crypto markets are highly unpredictable, placing a stop-loss below the recent swing low helps manage risk effectively and protects capital from sudden reversals.
Disclaimer:info@kdj.com
The information provided is not trading advice. kdj.com does not assume any responsibility for any investments made based on the information provided in this article. Cryptocurrencies are highly volatile and it is highly recommended that you invest with caution after thorough research!
If you believe that the content used on this website infringes your copyright, please contact us immediately (info@kdj.com) and we will delete it promptly.
- Ethereum Ecosystem's $7.3B Fee Bonanza: Tether, Circle, Lido Lead the Charge
- 2025-06-26 17:05:11
- Bitcoin, Cryptocurrency, Price Rise: What's the Deal?
- 2025-06-26 16:30:11
- Pepe Mania: Whale Buys and the Meme Coin Frenzy
- 2025-06-26 16:50:13
- Bitcoin Price: Riding the Upward Trend – Will BTC Hit New Highs?
- 2025-06-26 16:50:13
- Bitcoin Price Prediction, June 27: Will the Rally Continue?
- 2025-06-26 17:07:13
- Coinbase Soars: Sanford Bernstein's Bullish Price Target and the Genius Act
- 2025-06-26 16:54:12
Related knowledge
Should I leave the market when the volume rises and falls but does not break the 5-day line?
Jun 26,2025 at 06:08pm
Understanding Market Volume and the 5-Day Moving AverageWhen traders talk about market volume, they're referring to the total number of shares or contracts traded during a specific period. In cryptocurrency trading, volume plays a crucial role in confirming trends and predicting potential reversals. The 5-day moving average (5DMA) is a short-term indica...
Break through the downward trend line but can the volume generally follow up?
Jun 26,2025 at 05:28pm
Understanding the Significance of Breaking a Downward Trend LineIn technical analysis, a downward trend line represents a resistance level formed by connecting two or more high points in price action. When the price breaks above this line, it suggests that the selling pressure may be weakening and that buyers are gaining control. This is often seen as a...
Will the time-sharing chart open higher the next day after the end of the trading?
Jun 26,2025 at 04:35pm
Understanding Time-Sharing Charts in Cryptocurrency TradingIn the realm of cryptocurrency trading, time-sharing charts, often referred to as tick or intraday charts, play a crucial role in analyzing short-term price movements. These charts display price fluctuations over very small time intervals, such as 1 minute, 5 minutes, or 15 minutes. Traders rely...
Can I chase it if the continuous small positive lines push it up but the increase is limited?
Jun 26,2025 at 03:42pm
Understanding the Concept of Continuous Small Positive LinesIn the realm of cryptocurrency trading, continuous small positive lines refer to a pattern where an asset's price consistently rises in small increments over a period. These movements are typically observed on candlestick charts and can indicate underlying strength or accumulation by larger pla...
Is it necessary to run if the high propeller K line opens low the next day?
Jun 26,2025 at 01:42pm
Understanding the High Propeller K LineA high propeller K line is a candlestick pattern that typically indicates indecision in the market. It features a small real body with long upper and lower shadows, suggesting that both buyers and sellers are active. This pattern often appears during periods of volatility and can signal potential reversals or conti...

Is it a reversal confirmation if the long lower shadow line at a low position opens high the next day?
Jun 26,2025 at 03:08pm
Understanding Candlestick Patterns in Cryptocurrency TradingIn the world of cryptocurrency trading, candlestick patterns are widely used by traders to analyze market sentiment and predict future price movements. These visual representations provide insights into buying and selling pressures at specific price points. One such pattern that often catches t...

Should I leave the market when the volume rises and falls but does not break the 5-day line?
Jun 26,2025 at 06:08pm
Understanding Market Volume and the 5-Day Moving AverageWhen traders talk about market volume, they're referring to the total number of shares or contracts traded during a specific period. In cryptocurrency trading, volume plays a crucial role in confirming trends and predicting potential reversals. The 5-day moving average (5DMA) is a short-term indica...

Break through the downward trend line but can the volume generally follow up?
Jun 26,2025 at 05:28pm
Understanding the Significance of Breaking a Downward Trend LineIn technical analysis, a downward trend line represents a resistance level formed by connecting two or more high points in price action. When the price breaks above this line, it suggests that the selling pressure may be weakening and that buyers are gaining control. This is often seen as a...

Will the time-sharing chart open higher the next day after the end of the trading?
Jun 26,2025 at 04:35pm
Understanding Time-Sharing Charts in Cryptocurrency TradingIn the realm of cryptocurrency trading, time-sharing charts, often referred to as tick or intraday charts, play a crucial role in analyzing short-term price movements. These charts display price fluctuations over very small time intervals, such as 1 minute, 5 minutes, or 15 minutes. Traders rely...

Can I chase it if the continuous small positive lines push it up but the increase is limited?
Jun 26,2025 at 03:42pm
Understanding the Concept of Continuous Small Positive LinesIn the realm of cryptocurrency trading, continuous small positive lines refer to a pattern where an asset's price consistently rises in small increments over a period. These movements are typically observed on candlestick charts and can indicate underlying strength or accumulation by larger pla...

Is it necessary to run if the high propeller K line opens low the next day?
Jun 26,2025 at 01:42pm
Understanding the High Propeller K LineA high propeller K line is a candlestick pattern that typically indicates indecision in the market. It features a small real body with long upper and lower shadows, suggesting that both buyers and sellers are active. This pattern often appears during periods of volatility and can signal potential reversals or conti...

Is it a reversal confirmation if the long lower shadow line at a low position opens high the next day?
Jun 26,2025 at 03:08pm
Understanding Candlestick Patterns in Cryptocurrency TradingIn the world of cryptocurrency trading, candlestick patterns are widely used by traders to analyze market sentiment and predict future price movements. These visual representations provide insights into buying and selling pressures at specific price points. One such pattern that often catches t...
See all articles


