


![[Multi SUB] |His soul has penetrated the King of Shu and is bound to the strongest system, giving him 108 shadow bodyguards and eighteen special forces at the beginning! He turned around to start an industry and run a newspaper, and ruined the aristocratic family and the prince. From then on, he grabbed the beauty of both the country and the country! ! #剧energychargingstation#MiniDrama#Wonderful mainland short drama](/uploads/2026/06/17/cryptocurrencies-news/videos/origin_6a3220c2ed276_image_500_375.webp "[Multi SUB] |His soul has penetrated the King of Shu and is bound to the strongest system, giving him 108 shadow bodyguards and eighteen special forces at the beginning! He turned around to start an industry and run a newspaper, and ruined the aristocratic family and the prince. From then on, he grabbed the beauty of both the country and the country! ! #剧energychargingstation#MiniDrama#Wonderful mainland short drama")


![[Awakening of Nations] The cavalry commander is quietly getting weaker? (Current performance and future development of the Cavalry)](/uploads/2026/06/17/cryptocurrencies-news/videos/origin_6a32257ba21bc_image_500_375.webp "[Awakening of Nations] The cavalry commander is quietly getting weaker? (Current performance and future development of the Cavalry)")


-
 bitcoin
 $87959.907984 USD
1.34% - ethereum
$2920.497338 USD
3.04% - tether
$0.999775 USD
0.00% - xrp
$2.237324 USD
8.12% - bnb
$860.243768 USD
0.90% - solana
$138.089498 USD
5.43% - usd-coin
$0.999807 USD
0.01% - tron
$0.272801 USD
-1.53% - dogecoin
$0.150904 USD
2.96% - cardano
$0.421635 USD
1.97% - hyperliquid
$32.152445 USD
2.23% - bitcoin-cash
$533.301069 USD
-1.94% - chainlink
$12.953417 USD
2.68% - unus-sed-leo
$9.535951 USD
0.73% - zcash
$521.483386 USD
-2.87%


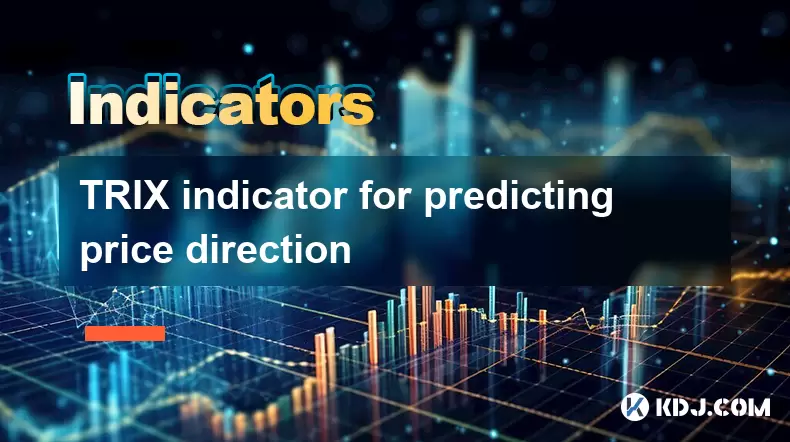
TRIX indicator for predicting price direction
The TRIX indicator helps cryptocurrency traders identify trend reversals and momentum shifts by smoothing price data through triple exponential moving averages.
Jul 12, 2025 at 06:14 pm
What is the TRIX Indicator?
The TRIX (Triple Exponential Average) indicator is a momentum oscillator used in technical analysis to identify oversold and overbought levels, as well as potential trend reversals. Developed by Jack Hutson in the 1980s, TRIX is designed to filter out market noise by applying triple exponential smoothing to price data. This makes it particularly useful for traders who want to gauge the strength of a trend or anticipate changes in price direction.
Unlike simple moving averages that can be heavily influenced by short-term volatility, TRIX smooths out price movements through multiple layers of exponential moving averages (EMA), providing a more reliable signal for predicting directional bias in cryptocurrency markets.
How Does TRIX Work in Cryptocurrency Trading?
In the volatile world of cryptocurrency trading, the TRIX indicator helps traders detect subtle shifts in momentum that may precede significant price moves. It oscillates around a zero line, with values above zero suggesting bullish momentum and values below zero indicating bearish momentum.
- When TRIX crosses above the zero line, it signals increasing upward momentum.
- Conversely, when TRIX crosses below the zero line, it indicates growing downward pressure.
Moreover, divergences between the TRIX line and price action can highlight potential reversals. For example, if the price of Bitcoin hits a new high but TRIX fails to surpass its previous high, this divergence may suggest weakening momentum and an impending reversal.
Calculating the TRIX Indicator
To understand how TRIX works under the hood, it’s important to grasp its calculation method:
- First, calculate a 14-period EMA of closing prices.
- Then, compute a second EMA of the first EMA (this is the double-smoothed EMA).
- Next, apply a third EMA to the double-smoothed EMA (triple smoothing).
- Finally, calculate the percentage change between today’s and yesterday’s triple-smoothed EMA.
This triple smoothing process ensures that TRIX filters out minor price fluctuations, focusing instead on meaningful changes in trend direction. Most trading platforms automatically perform these calculations, so traders don’t need to do them manually.
Using TRIX to Predict Price Direction
TRIX can serve as a powerful tool for predicting price direction in crypto markets by analyzing three key signals:
- Zero Line Crossovers: A move above zero suggests a bullish shift, while crossing below zero hints at a bearish turn.
- Signal Line Crossovers: Adding a signal line (typically a 9-period EMA of TRIX) allows traders to spot buy/sell signals when TRIX crosses above or below this line.
- Divergence Analysis: When the price moves in one direction but TRIX moves opposite, it often signals a potential trend exhaustion point.
For instance, during a strong uptrend in Ethereum's price, if TRIX begins to flatten or decline despite rising prices, it could indicate that the rally is losing steam and a correction may be imminent.
Setting Up TRIX on a Trading Platform
Most modern trading platforms like Binance, TradingView, or MetaTrader include the TRIX indicator as part of their built-in tools. Here’s how you can set it up:
- Open your preferred charting platform and select the cryptocurrency pair you're interested in.
- Locate the indicators menu, usually found on the top toolbar or within the settings panel.
- Type “TRIX” into the search bar and add it to your chart.
- You can adjust the period length (default is usually 14) depending on your trading style—shorter periods make TRIX more sensitive, longer periods smoother.
- If available, enable the signal line feature to enhance crossover strategies.
Once applied, observe how the TRIX line interacts with the zero line and any added signal line to help determine potential entries and exits.
Combining TRIX with Other Indicators
While TRIX is effective on its own, combining it with other technical tools can improve accuracy and reduce false signals. Some common combinations include:
- MACD: Both are momentum indicators, but they measure different aspects; using them together can confirm trend strength and potential reversals.
- RSI: Helps validate overbought or oversold conditions identified by TRIX, especially useful in ranging markets.
- Volume indicators: Volume surges accompanying TRIX crossovers can provide additional confirmation of trend validity.
By layering these tools, traders can build a more robust strategy for navigating the unpredictable nature of crypto price movements.
Frequently Asked Questions (FAQ)
Q: Can TRIX be used effectively in highly volatile crypto markets?A: Yes, TRIX is particularly useful in volatile environments because its triple smoothing reduces erratic signals. However, adjusting the period setting can help fine-tune sensitivity to match market conditions.
Q: Is TRIX suitable for day trading cryptocurrencies?A: Absolutely, TRIX can be adapted for intraday trading by using shorter timeframes and smaller period settings. Traders often combine it with candlestick patterns or volume spikes for better timing.
Q: How does TRIX differ from MACD?A: While both are momentum indicators, TRIX uses triple smoothing and focuses on the rate of change of a triple EMA, whereas MACD compares two EMAs directly. TRIX tends to generate fewer false signals due to its advanced smoothing technique.
Q: What is the best period setting for TRIX in crypto trading?A: The default 14-period setting works well for most scenarios, but active traders might prefer adjusting it between 10 and 20 based on asset volatility and personal strategy preferences.
Disclaimer:info@kdj.com
The information provided is not trading advice. kdj.com does not assume any responsibility for any investments made based on the information provided in this article. Cryptocurrencies are highly volatile and it is highly recommended that you invest with caution after thorough research!
If you believe that the content used on this website infringes your copyright, please contact us immediately (info@kdj.com) and we will delete it promptly.


- Bitcoin, eCash Fork, and Airdrop Dynamics: A Deep Dive into Crypto's Latest Controversies
- 2026-05-03 12:55:01
- Consensus 2026 Miami: Web3, Blockchain, Cryptocurrency, NFTs, Metaverse, Conference, May 5th — Where Wall Street Meets the Digital Frontier
- 2026-05-02 12:45:01
- Fed Holds Rates Steady, Triggering Bitcoin Price Drop Amidst Geopolitical Tensions
- 2026-05-01 06:45:01
- Bitcoin Miners Electrify the Grid: Ohio Gas Plant Acquisition Powers Up a New Era for Digital Gold
- 2026-05-01 00:45:01
- MegaETH's MEGA Token Hits the Big Apple: Setting New Performance Benchmarks for Real-Time Blockchain
- 2026-05-01 00:55:01
- Solana's Slippery Slope: Price Prediction Points to Resistance Loss and Potential Further Drops
- 2026-05-01 06:45:01
Related knowledge

What Are the Most Popular Crypto Indicators in 2026? Which Ones Still Work?
Jun 15,2026 at 04:40pm
RSI: The Enduring Momentum Gauge1. RSI remains one of the most widely adopted indicators across all timeframes, from scalping to position trading. 2. ...

What Is the Aroon Indicator? Can It Help Predict New Trends?
Jun 13,2026 at 01:37am
Market Volatility Patterns1. Bitcoin price swings often exceed 5% within a single trading session during high-liquidity events such as ETF inflow anno...

How to Confirm Trend Reversals Before Entering a Trade?
Jun 12,2026 at 02:39pm
Market Volatility Patterns1. Bitcoin’s price movements often reflect macroeconomic signals such as Federal Reserve interest rate decisions and inflati...

What Is a Volume Spike? Does It Signal a Major Price Move?
Jun 14,2026 at 03:20pm
Understanding Volume Spikes in Cryptocurrency Markets1. A volume spike refers to a sudden and substantial increase in the number of tokens traded with...

How to Use K-Line Indicators During High Volatility Events?
Jun 13,2026 at 11:21pm
K-Line Structure Recognition in Extreme Market Conditions1. A single K-line during high volatility often exhibits abnormally long wicks, indicating ra...

What Is the Best Indicator Combination for Bitcoin Trading?
Jun 13,2026 at 08:20am
BTC.D and Market Phase Recognition1. BTC.D reflects the proportional weight of Bitcoin’s market capitalization against the aggregate crypto market cap...
What Are the Most Popular Crypto Indicators in 2026? Which Ones Still Work?
Jun 15,2026 at 04:40pm
RSI: The Enduring Momentum Gauge1. RSI remains one of the most widely adopted indicators across all timeframes, from scalping to position trading. 2. ...
What Is the Aroon Indicator? Can It Help Predict New Trends?
Jun 13,2026 at 01:37am
Market Volatility Patterns1. Bitcoin price swings often exceed 5% within a single trading session during high-liquidity events such as ETF inflow anno...
How to Confirm Trend Reversals Before Entering a Trade?
Jun 12,2026 at 02:39pm
Market Volatility Patterns1. Bitcoin’s price movements often reflect macroeconomic signals such as Federal Reserve interest rate decisions and inflati...
What Is a Volume Spike? Does It Signal a Major Price Move?
Jun 14,2026 at 03:20pm
Understanding Volume Spikes in Cryptocurrency Markets1. A volume spike refers to a sudden and substantial increase in the number of tokens traded with...
How to Use K-Line Indicators During High Volatility Events?
Jun 13,2026 at 11:21pm
K-Line Structure Recognition in Extreme Market Conditions1. A single K-line during high volatility often exhibits abnormally long wicks, indicating ra...
What Is the Best Indicator Combination for Bitcoin Trading?
Jun 13,2026 at 08:20am
BTC.D and Market Phase Recognition1. BTC.D reflects the proportional weight of Bitcoin’s market capitalization against the aggregate crypto market cap...
See all articles


