


![[Updated Season 5] Watch Seasons 1-5 in one go🔥Starting with a mortal body and useless roots, he was despised by the whole family! His hard core awakens the mysterious black tank and starts the replication of all things | MULTI SUB](/uploads/2026/07/02/cryptocurrencies-news/videos/origin_6a45e757ec145_image_500_375.webp "[Updated Season 5] Watch Seasons 1-5 in one go🔥Starting with a mortal body and useless roots, he was despised by the whole family! His hard core awakens the mysterious black tank and starts the replication of all things | MULTI SUB")


-
 bitcoin
 $87959.907984 USD
1.34% - ethereum
$2920.497338 USD
3.04% - tether
$0.999775 USD
0.00% - xrp
$2.237324 USD
8.12% - bnb
$860.243768 USD
0.90% - solana
$138.089498 USD
5.43% - usd-coin
$0.999807 USD
0.01% - tron
$0.272801 USD
-1.53% - dogecoin
$0.150904 USD
2.96% - cardano
$0.421635 USD
1.97% - hyperliquid
$32.152445 USD
2.23% - bitcoin-cash
$533.301069 USD
-1.94% - chainlink
$12.953417 USD
2.68% - unus-sed-leo
$9.535951 USD
0.73% - zcash
$521.483386 USD
-2.87%


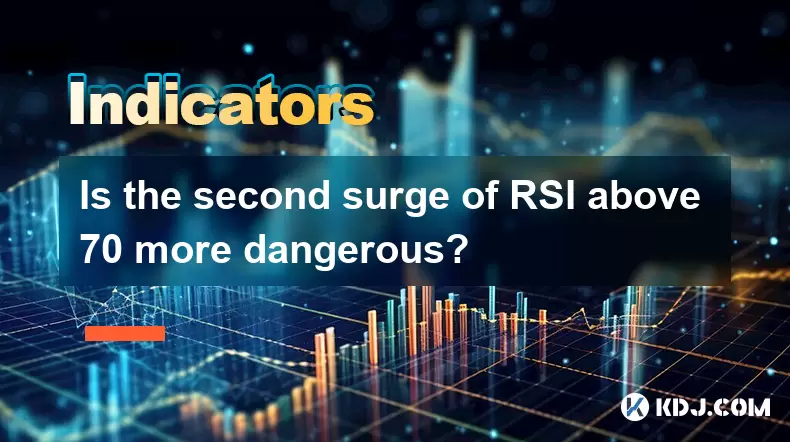
Is the second surge of RSI above 70 more dangerous?
In crypto trading, a second RSI surge above 70 may signal weakening bullish momentum and a potential bearish reversal.
Jun 18, 2025 at 12:00 pm
Understanding RSI and Its Significance in Cryptocurrency Trading
The Relative Strength Index (RSI) is a momentum oscillator used to measure the speed and change of price movements. In the cryptocurrency market, where volatility reigns supreme, RSI becomes an essential tool for traders. Typically ranging from 0 to 100, RSI values above 70 are considered overbought, while values below 30 are deemed oversold. When RSI rises above 70, it signals that an asset may be overbought, potentially indicating an upcoming reversal or pullback.
In crypto trading, especially for volatile assets like Bitcoin or altcoins, seeing RSI breach 70 isn't uncommon. However, the concern arises when RSI makes a second surge above 70, which some traders interpret as a stronger bearish signal compared to the first instance.
Important Note: An overbought RSI doesn't necessarily mean an immediate price drop. It simply suggests caution and the need for further confirmation through other indicators.
What Happens During the First Surge of RSI Above 70?
During the first surge of RSI above 70, many traders view it as a potential sign of strength rather than weakness. In strong uptrends, especially in bull markets, prices can remain overbought for extended periods without significant pullbacks. This behavior is often seen in fast-moving cryptocurrencies where FOMO (fear of missing out) drives rapid price appreciation.
Traders who rely solely on RSI might get stopped out prematurely if they short the market based only on this initial overbought reading. Therefore, it's crucial to combine RSI with other technical tools such as moving averages, volume analysis, or Fibonacci retracement levels to confirm potential reversals.
- First-time overbought conditions may indicate continued bullish momentum.
- It’s common during breakout scenarios or after major news events.
- Relying only on RSI at this stage can lead to false signals.
Why Is the Second Surge of RSI Above 70 Considered More Dangerous?
When RSI returns to overbought territory after a brief pullback, forming what's known as a double top pattern or a retest, it raises concerns among experienced traders. The second time RSI hits 70 or higher, it suggests that buyers are once again pushing the price upward, but with less conviction than before.
This scenario often indicates weakening momentum and a possible exhaustion of buying pressure. If the price fails to make a new high while RSI reaches similar or lower levels, it creates a bearish divergence, signaling a potential reversal.
- Second surge may reflect weakening bullish momentum despite rising prices.
- Bearish divergences become more apparent during this phase.
- Volume patterns should be checked to confirm lack of participation.
How to Confirm Whether the Second RSI Surge Is a Valid Warning Signal?
To determine whether the second RSI surge is indeed dangerous, traders must look beyond the indicator itself. Here are key steps to validate the warning:
- Check for price action rejection near resistance zones—look for long upper wicks or bearish candlestick patterns.
- Analyze volume trends—if volume declines during the second RSI surge, it may indicate reduced buyer interest.
- Use trendlines or moving averages to assess support and resistance levels—breaks below these can confirm a reversal.
- Observe other oscillators like MACD for confirmation of momentum shift.
For example, if RSI hits 70 twice, and on the second attempt, the MACD line crosses below the signal line, it adds weight to the bearish outlook.
Case Study: How the Second RSI Surge Played Out in a Real Crypto Scenario
Let’s take a hypothetical case using a popular altcoin chart. Suppose Ethereum breaks out from a consolidation phase and rallies sharply. RSI climbs above 70, prompting early warnings of overbought conditions. However, the price continues upward due to strong demand.
After reaching a peak, ETH pulls back slightly, RSI dips below 70, and then another wave of buying pushes the price up again. RSI surges back above 70. But this time, the rally lacks the same volume as before, and the price fails to surpass the previous high.
- Bullish sentiment weakens even though RSI appears similar to the first surge.
- Traders observing divergence between RSI and price might initiate short positions or tighten stop-losses on longs.
- The eventual breakdown below key support confirms the reversal.
This scenario illustrates why the second surge can be more dangerous—it often precedes a meaningful correction or trend reversal.
Frequently Asked Questions
Q1: Can RSI stay above 70 for a prolonged period without a price reversal?Yes, especially in strong uptrends or during periods of extreme speculation. In such cases, RSI can remain overbought for extended durations. Traders should not assume an automatic reversal just because RSI is above 70.
Q2: Should I always avoid buying when RSI is above 70?Not necessarily. Buying in overbought conditions can still be profitable in a strong uptrend. However, it requires additional confirmation and proper risk management strategies.
Q3: What timeframes are best for analyzing RSI surges?Shorter timeframes like 1-hour or 4-hour charts tend to show more frequent RSI spikes, while daily charts offer more reliable signals. Combining multiple timeframes helps filter noise and identify stronger trends.
Q4: Does the second RSI surge always result in a bearish reversal?No, it does not guarantee a reversal. The second surge serves as a warning sign, but actual reversals depend on broader market dynamics, including volume, macroeconomic factors, and overall investor sentiment.
Disclaimer:info@kdj.com
The information provided is not trading advice. kdj.com does not assume any responsibility for any investments made based on the information provided in this article. Cryptocurrencies are highly volatile and it is highly recommended that you invest with caution after thorough research!
If you believe that the content used on this website infringes your copyright, please contact us immediately (info@kdj.com) and we will delete it promptly.


- Bitcoin, eCash Fork, and Airdrop Dynamics: A Deep Dive into Crypto's Latest Controversies
- 2026-05-03 12:55:01
- Consensus 2026 Miami: Web3, Blockchain, Cryptocurrency, NFTs, Metaverse, Conference, May 5th — Where Wall Street Meets the Digital Frontier
- 2026-05-02 12:45:01
- Fed Holds Rates Steady, Triggering Bitcoin Price Drop Amidst Geopolitical Tensions
- 2026-05-01 06:45:01
- Bitcoin Miners Electrify the Grid: Ohio Gas Plant Acquisition Powers Up a New Era for Digital Gold
- 2026-05-01 00:45:01
- MegaETH's MEGA Token Hits the Big Apple: Setting New Performance Benchmarks for Real-Time Blockchain
- 2026-05-01 00:55:01
- Solana's Slippery Slope: Price Prediction Points to Resistance Loss and Potential Further Drops
- 2026-05-01 06:45:01
Related knowledge

How does RSI overextension signal potential crypto correction?
Jun 29,2026 at 04:39pm
RSI Overextension Mechanics in Crypto Markets1. RSI values above 70 indicate overbought conditions where buying pressure has exhausted itself across m...

What is stochastic RSI crossover strategy in crypto trading?
Jun 29,2026 at 02:00pm
Stochastic RSI Fundamentals in Cryptocurrency Markets1. Stochastic RSI is derived from the standard RSI but applies stochastic oscillator logic to its...

What does OBV spike reveal about crypto whale activity?
Jun 30,2026 at 01:19am
On-Balance Volume and Whale Accumulation Patterns1. A sharp OBV spike coincides with unusually large inflows into exchange wallets, often preceding su...

How does ATR spike indicate panic selling in crypto markets?
Jun 28,2026 at 03:39pm
ATR Spike as a Real-Time Panic Signal1. The Average True Range (ATR) measures volatility by calculating the average of true ranges over a defined peri...

How does SMA act as psychological level in crypto markets?
Jun 28,2026 at 06:19pm
Psychological Anchoring in Market Sentiment1. Social Media Addiction (SMA) manifests in crypto markets through persistent attention fixation on price ...

What is stochastic momentum index in crypto trading?
Jul 02,2026 at 01:40pm
Definition and Core Mechanics1. The Stochastic Momentum Index (SMI) is a refined oscillator derived from the classic Stochastic Oscillator, adapted fo...
How does RSI overextension signal potential crypto correction?
Jun 29,2026 at 04:39pm
RSI Overextension Mechanics in Crypto Markets1. RSI values above 70 indicate overbought conditions where buying pressure has exhausted itself across m...
What is stochastic RSI crossover strategy in crypto trading?
Jun 29,2026 at 02:00pm
Stochastic RSI Fundamentals in Cryptocurrency Markets1. Stochastic RSI is derived from the standard RSI but applies stochastic oscillator logic to its...
What does OBV spike reveal about crypto whale activity?
Jun 30,2026 at 01:19am
On-Balance Volume and Whale Accumulation Patterns1. A sharp OBV spike coincides with unusually large inflows into exchange wallets, often preceding su...
How does ATR spike indicate panic selling in crypto markets?
Jun 28,2026 at 03:39pm
ATR Spike as a Real-Time Panic Signal1. The Average True Range (ATR) measures volatility by calculating the average of true ranges over a defined peri...
How does SMA act as psychological level in crypto markets?
Jun 28,2026 at 06:19pm
Psychological Anchoring in Market Sentiment1. Social Media Addiction (SMA) manifests in crypto markets through persistent attention fixation on price ...
What is stochastic momentum index in crypto trading?
Jul 02,2026 at 01:40pm
Definition and Core Mechanics1. The Stochastic Momentum Index (SMI) is a refined oscillator derived from the classic Stochastic Oscillator, adapted fo...
See all articles


