


")


-
 Bitcoin
 $112200
0.96% - Ethereum
$4310
0.64% - XRP
$2.978
4.28% - Tether USDt
$0.9999
-0.02% - BNB
$877.9
0.29% - Solana
$215.6
6.68% - USDC
$0.9997
-0.02% - Dogecoin
$0.2387
7.54% - TRON
$0.3316
0.73% - Cardano
$0.8633
4.49% - Hyperliquid
$50.46
7.52% - Chainlink
$23.01
3.82% - Ethena USDe
$1.001
-0.01% - Sui
$3.469
2.94% - Stellar
$0.3750
4.79% - Bitcoin Cash
$587.2
-2.71% - Avalanche
$25.48
4.50% - Hedera
$0.2258
3.79% - UNUS SED LEO
$9.548
0.05% - Litecoin
$112.7
-1.24% - Cronos
$0.2527
-2.26% - Toncoin
$3.098
-0.03% - Shiba Inu
$0.00001287
4.08% - Polkadot
$4.037
1.46% - Uniswap
$9.567
3.02% - Dai
$0.9997
-0.01% - Ethena
$0.7735
5.26% - World Liberty Financial
$0.2077
-7.48% - Monero
$271.3
0.38% - Aave
$302.8
1.35%


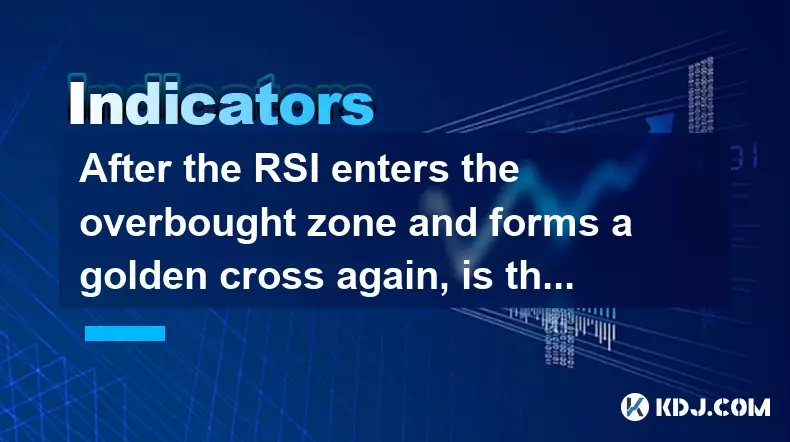
After the RSI enters the overbought zone and forms a golden cross again, is this an acceleration of the rise or the final frenzy?
A golden cross with overbought RSI signals strong bullish momentum but may also hint at exhaustion—confirm with volume, on-chain data, and leverage trends.
Sep 01, 2025 at 08:54 am
Understanding RSI and Golden Cross in Crypto Markets
1. The Relative Strength Index (RSI) is a momentum oscillator widely used in cryptocurrency trading to measure the speed and change of price movements. When RSI surpasses 70, it enters the overbought zone, signaling that an asset may be overvalued. Traders often interpret this as a potential reversal point, though in strong bullish trends, overbought conditions can persist.
2. A golden cross occurs when a short-term moving average, such as the 50-day, crosses above a long-term moving average like the 200-day. In the context of digital assets, this pattern is seen as a bullish signal, suggesting the beginning of a prolonged upward trend.
3. When the RSI is already in overbought territory and a golden cross forms simultaneously, it creates a conflicting picture. On one hand, the golden cross suggests strengthening momentum. On the other, the overbought RSI warns of exhaustion.
4. In highly volatile markets like Bitcoin or Ethereum, such combinations are not uncommon during parabolic phases. These conditions often reflect strong investor sentiment and inflows from institutional capital, pushing prices higher despite technical overextension.
5. Historical patterns in previous bull runs show that overbought RSI readings accompanied by golden crosses have preceded both sustained rallies and sharp corrections. The outcome depends heavily on broader market structure, volume trends, and macroeconomic factors.
Signs of Acceleration vs. Final Frenzy
1. Sustained acceleration is often confirmed by increasing trading volume, growing open interest in futures markets, and consistent higher highs and higher lows on price charts. When these elements align with the golden cross and overbought RSI, the rally may still have room to expand.
2. The final frenzy, however, tends to exhibit divergences. For example, if price reaches new highs but RSI fails to surpass its previous peak, this bearish divergence hints at weakening momentum. Such patterns were evident during the 2021 Bitcoin peak and several altcoin tops.
3. Social sentiment plays a crucial role. Extreme bullishness on social platforms, record leverage in perpetual futures, and widespread media coverage often accompany the final stages of a rally. These psychological indicators can outweigh technical signals.
4. On-chain metrics provide additional clarity. A drop in exchange outflows, slowing accumulation by long-term holders, and rising supply on exchanges may indicate that smart money is exiting, even as retail participation surges.
5. Liquidity distribution across centralized and decentralized exchanges also matters. Thin order books on major exchanges during rapid price increases suggest vulnerability to sudden reversals, especially if large sell walls appear.
Market Structure and Institutional Influence
1. The growing presence of institutional players has altered traditional technical patterns. Large capital inflows through ETFs or corporate treasuries can sustain overbought conditions far longer than in earlier cycles, making historical comparisons less reliable.
2. Regulatory developments impact how technical signals play out. Announcements about crypto-friendly policies or crackdowns can override RSI and moving average signals, triggering sharp directional moves regardless of technical positioning.
3. Stablecoin dynamics are increasingly important. Rapid issuance of stablecoins like USDT or USDC often precedes bullish phases, as they represent dry powder entering the ecosystem. Conversely, declining stablecoin supply can signal reduced buying pressure.
4. Derivatives markets now play a central role. Elevated funding rates in perpetual swaps, especially when combined with overbought RSI, reflect aggressive long positioning. This can lead to cascading liquidations if sentiment shifts suddenly.
5. Miner behavior also influences outcomes. During bull runs, miners may hold or sell reserves based on operational costs and market expectations. Large-scale selling by miners after a price spike can act as a catalyst for reversals, even amid positive technical indicators.
Frequently Asked Questions
What does a golden cross imply when RSI is over 70?It suggests strong bullish momentum, but also potential overextension. The combination requires confirmation from volume and on-chain data to determine whether the trend is sustainable or nearing exhaustion.
Can RSI remain overbought during a major bull run?Yes. In strong uptrends, RSI can stay above 70 for extended periods. This is especially common in crypto markets where FOMO-driven buying pushes prices higher despite traditional overbought readings.
How do on-chain metrics help interpret this scenario?Metrics like exchange inflows, whale accumulation, and hash rate trends provide context. For example, if large holders are accumulating while RSI is high, it may support further upside rather than indicate a top.
What role does leverage play in overbought conditions?High leverage in futures markets amplifies both gains and risks. During overbought phases with golden crosses, excessive leverage increases the likelihood of sharp corrections due to liquidation cascades.
Disclaimer:info@kdj.com
The information provided is not trading advice. kdj.com does not assume any responsibility for any investments made based on the information provided in this article. Cryptocurrencies are highly volatile and it is highly recommended that you invest with caution after thorough research!
If you believe that the content used on this website infringes your copyright, please contact us immediately (info@kdj.com) and we will delete it promptly.


- Worldcoin's Wild Ride: Treasury Tactics and Price Gains, a New York Minute
- 2025-09-09 14:25:15
- Hotcoin Lists Luxury Travel Token (LTT): Your Ticket to Crypto-Fueled Luxury?
- 2025-09-09 14:25:15
- Household Debt: Peeking into the 2025 Crystal Ball
- 2025-09-09 12:25:15
- Bitcoin Core, Censorship, and the Ordinals Leader: A Showdown Looms?
- 2025-09-09 12:25:15
- Bitcoin, Solana, and Hacks: Navigating the Crypto Minefield, the New York Way
- 2025-09-09 12:30:12
- AI Models, Bitcoin Trend, and the September Shock: What's the Deal?
- 2025-09-09 12:30:12
Related knowledge

Is the RSI entering the oversold zone a golden signal for buying the dip?
Sep 09,2025 at 02:55pm
Understanding the RSI and Its Role in Crypto Trading1. The Relative Strength Index (RSI) is a momentum oscillator widely used in the cryptocurrency ma...

Is a MACD histogram turning from green to red a long signal?
Sep 09,2025 at 01:54pm
Understanding the MACD Histogram in Crypto Trading1. The MACD (Moving Average Convergence Divergence) histogram is a visual representation of the diff...

What does it mean when the DIF and DEA lines of the MACD line converge underwater?
Sep 09,2025 at 07:55am
Understanding MACD Components in Bearish Territory1. The MACD indicator consists of three elements: the DIF (Difference), DEA (Signal line), and the M...

Is the red-green reversal point of the SAR indicator a precise buy or sell point?
Sep 09,2025 at 11:18am
Understanding the SAR Indicator in Cryptocurrency TradingThe SAR (Stop and Reverse) indicator, developed by J. Welles Wilder Jr., is a popular tool us...

How can I determine the market direction after a doji candlestick pattern appears?
Sep 09,2025 at 05:37am
Understanding the Doji Candlestick in Crypto Markets1. The doji candlestick is a critical formation that signals indecision between buyers and sellers...

How do I confirm a reversal after a "Morning Star" candlestick pattern appears?
Sep 09,2025 at 05:19am
Understanding the Morning Star Candlestick Pattern1. The Morning Star is a bullish reversal pattern that typically forms at the end of a downtrend. It...
Is the RSI entering the oversold zone a golden signal for buying the dip?
Sep 09,2025 at 02:55pm
Understanding the RSI and Its Role in Crypto Trading1. The Relative Strength Index (RSI) is a momentum oscillator widely used in the cryptocurrency ma...
Is a MACD histogram turning from green to red a long signal?
Sep 09,2025 at 01:54pm
Understanding the MACD Histogram in Crypto Trading1. The MACD (Moving Average Convergence Divergence) histogram is a visual representation of the diff...
What does it mean when the DIF and DEA lines of the MACD line converge underwater?
Sep 09,2025 at 07:55am
Understanding MACD Components in Bearish Territory1. The MACD indicator consists of three elements: the DIF (Difference), DEA (Signal line), and the M...
Is the red-green reversal point of the SAR indicator a precise buy or sell point?
Sep 09,2025 at 11:18am
Understanding the SAR Indicator in Cryptocurrency TradingThe SAR (Stop and Reverse) indicator, developed by J. Welles Wilder Jr., is a popular tool us...
How can I determine the market direction after a doji candlestick pattern appears?
Sep 09,2025 at 05:37am
Understanding the Doji Candlestick in Crypto Markets1. The doji candlestick is a critical formation that signals indecision between buyers and sellers...
How do I confirm a reversal after a "Morning Star" candlestick pattern appears?
Sep 09,2025 at 05:19am
Understanding the Morning Star Candlestick Pattern1. The Morning Star is a bullish reversal pattern that typically forms at the end of a downtrend. It...
See all articles


