


![[Multi SUB] |His soul has penetrated the King of Shu and is bound to the strongest system, giving him 108 shadow bodyguards and eighteen special forces at the beginning! He turned around to start an industry and run a newspaper, and ruined the aristocratic family and the prince. From then on, he grabbed the beauty of both the country and the country! ! #剧energychargingstation#MiniDrama#Wonderful mainland short drama](/uploads/2026/06/17/cryptocurrencies-news/videos/origin_6a3220c2ed276_image_500_375.webp "[Multi SUB] |His soul has penetrated the King of Shu and is bound to the strongest system, giving him 108 shadow bodyguards and eighteen special forces at the beginning! He turned around to start an industry and run a newspaper, and ruined the aristocratic family and the prince. From then on, he grabbed the beauty of both the country and the country! ! #剧energychargingstation#MiniDrama#Wonderful mainland short drama")


![[Awakening of Nations] The cavalry commander is quietly getting weaker? (Current performance and future development of the Cavalry)](/uploads/2026/06/17/cryptocurrencies-news/videos/origin_6a32257ba21bc_image_500_375.webp "[Awakening of Nations] The cavalry commander is quietly getting weaker? (Current performance and future development of the Cavalry)")


-
 bitcoin
 $87959.907984 USD
1.34% - ethereum
$2920.497338 USD
3.04% - tether
$0.999775 USD
0.00% - xrp
$2.237324 USD
8.12% - bnb
$860.243768 USD
0.90% - solana
$138.089498 USD
5.43% - usd-coin
$0.999807 USD
0.01% - tron
$0.272801 USD
-1.53% - dogecoin
$0.150904 USD
2.96% - cardano
$0.421635 USD
1.97% - hyperliquid
$32.152445 USD
2.23% - bitcoin-cash
$533.301069 USD
-1.94% - chainlink
$12.953417 USD
2.68% - unus-sed-leo
$9.535951 USD
0.73% - zcash
$521.483386 USD
-2.87%


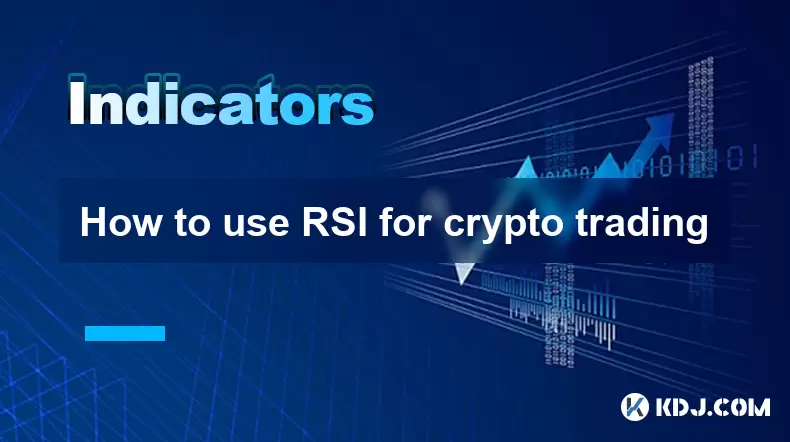
How to use RSI for crypto trading
The RSI indicator helps crypto traders identify overbought or oversold conditions, aiding in spotting potential price reversals and improving entry and exit timing when combined with other tools.
Jul 13, 2025 at 02:29 pm
Understanding the RSI Indicator in Crypto Trading
The Relative Strength Index (RSI) is a momentum oscillator used to measure the speed and change of price movements. In the cryptocurrency market, where volatility is high, RSI becomes a powerful tool for identifying overbought or oversold conditions. It operates on a scale from 0 to 100, with 70 typically indicating overbought levels and 30 signaling oversold levels. Traders use these thresholds to anticipate potential reversals or corrections in asset prices.
When applied to crypto trading, RSI helps traders assess whether a digital asset is currently overbought or oversold. This can be especially useful in identifying entry and exit points in fast-moving markets. However, it's important to note that RSI should not be used in isolation. Combining it with other indicators or price action analysis enhances its reliability.
Setting Up RSI for Crypto Trading Platforms
Most crypto trading platforms, including Binance, Coinbase, and KuCoin, offer built-in technical analysis tools that include RSI. To set up RSI on these platforms:
- Open the trading chart for the desired cryptocurrency pair.
- Look for the 'Indicators' or 'Studies' button on the chart interface.
- Search for 'Relative Strength Index (RSI)' and click to add it.
- Adjust the default settings if necessary; the standard period is 14, but some traders prefer 7 or 21 depending on their strategy.
- Choose the overbought (70) and oversold (30) levels if they are not already displayed.
Once set up, RSI will appear below the main price chart as a separate window with values fluctuating between 0 and 100. Monitoring these levels helps traders anticipate potential price pullbacks or rebounds.
Interpreting RSI Signals in Crypto Markets
Interpreting RSI correctly is crucial for making informed trading decisions. When the RSI line crosses above 70, it suggests that the asset may be overbought and due for a bearish correction. Conversely, when it dips below 30, the asset may be oversold, signaling a bullish rebound.
However, in strong trending markets, cryptocurrencies can remain overbought or oversold for extended periods. Therefore, it's essential to look for divergences between RSI and price action. For instance:
- If the price makes a new high but RSI does not, this is a bearish divergence, indicating weakening momentum.
- If the price makes a new low but RSI does not, this is a bullish divergence, suggesting potential strength ahead.
These signals can be especially useful in identifying trend reversals or continuation patterns in crypto trading.
Using RSI for Entry and Exit Points
Traders can use RSI to determine strategic entry and exit points in crypto trading. For example:
- When RSI crosses below 70, it may signal a good time to sell or short.
- When RSI crosses above 30, it might be a good opportunity to buy or cover a short position.
Some traders also use midline crossovers (RSI crossing above or below 50) to confirm trend strength. A move above 50 may indicate increasing bullish momentum, while a drop below 50 might suggest weakening buyer interest.
It's important to combine RSI signals with support and resistance levels, candlestick patterns, or other indicators like MACD or moving averages to increase the probability of successful trades.
Common Mistakes When Using RSI in Crypto Trading
While RSI is a powerful tool, it's often misused, leading to poor trading decisions. One of the most common mistakes is trading solely based on RSI levels without considering the broader market context. Cryptocurrencies can stay overbought or oversold for long periods during strong trends.
Another mistake is not adjusting the RSI period for different timeframes. The default 14-period setting works well for daily charts, but for intraday trading, shorter periods like 7 may provide more timely signals.
Additionally, many traders ignore divergence signals, which can be early indicators of trend exhaustion. Failing to incorporate these into analysis can lead to missed opportunities or early exits.
FAQs
What is the best RSI setting for crypto trading?The best RSI setting depends on the trader’s strategy and timeframe. The default 14-period setting is widely used for daily charts, while shorter periods like 7 may be better for intraday trading.
Can RSI be used for all cryptocurrencies?Yes, RSI can be applied to any cryptocurrency with sufficient trading volume and price data. However, results may vary based on market conditions and asset volatility.
Is RSI reliable during high volatility in crypto markets?RSI can still be useful during high volatility, but it may generate more false signals. Combining RSI with other tools like volume analysis or moving averages improves reliability.
How can I avoid false signals from RSI in crypto trading?To reduce false signals, traders should use RSI in conjunction with price action, trendlines, and other technical indicators. Also, paying attention to divergences can improve accuracy.
Disclaimer:info@kdj.com
The information provided is not trading advice. kdj.com does not assume any responsibility for any investments made based on the information provided in this article. Cryptocurrencies are highly volatile and it is highly recommended that you invest with caution after thorough research!
If you believe that the content used on this website infringes your copyright, please contact us immediately (info@kdj.com) and we will delete it promptly.


- Bitcoin, eCash Fork, and Airdrop Dynamics: A Deep Dive into Crypto's Latest Controversies
- 2026-05-03 12:55:01
- Consensus 2026 Miami: Web3, Blockchain, Cryptocurrency, NFTs, Metaverse, Conference, May 5th — Where Wall Street Meets the Digital Frontier
- 2026-05-02 12:45:01
- Fed Holds Rates Steady, Triggering Bitcoin Price Drop Amidst Geopolitical Tensions
- 2026-05-01 06:45:01
- Bitcoin Miners Electrify the Grid: Ohio Gas Plant Acquisition Powers Up a New Era for Digital Gold
- 2026-05-01 00:45:01
- MegaETH's MEGA Token Hits the Big Apple: Setting New Performance Benchmarks for Real-Time Blockchain
- 2026-05-01 00:55:01
- Solana's Slippery Slope: Price Prediction Points to Resistance Loss and Potential Further Drops
- 2026-05-01 06:45:01
Related knowledge

What Are the Most Popular Crypto Indicators in 2026? Which Ones Still Work?
Jun 15,2026 at 04:40pm
RSI: The Enduring Momentum Gauge1. RSI remains one of the most widely adopted indicators across all timeframes, from scalping to position trading. 2. ...

What Is the Aroon Indicator? Can It Help Predict New Trends?
Jun 13,2026 at 01:37am
Market Volatility Patterns1. Bitcoin price swings often exceed 5% within a single trading session during high-liquidity events such as ETF inflow anno...

How to Confirm Trend Reversals Before Entering a Trade?
Jun 12,2026 at 02:39pm
Market Volatility Patterns1. Bitcoin’s price movements often reflect macroeconomic signals such as Federal Reserve interest rate decisions and inflati...

What Is a Volume Spike? Does It Signal a Major Price Move?
Jun 14,2026 at 03:20pm
Understanding Volume Spikes in Cryptocurrency Markets1. A volume spike refers to a sudden and substantial increase in the number of tokens traded with...

How to Use K-Line Indicators During High Volatility Events?
Jun 13,2026 at 11:21pm
K-Line Structure Recognition in Extreme Market Conditions1. A single K-line during high volatility often exhibits abnormally long wicks, indicating ra...

What Is the Best Indicator Combination for Bitcoin Trading?
Jun 13,2026 at 08:20am
BTC.D and Market Phase Recognition1. BTC.D reflects the proportional weight of Bitcoin’s market capitalization against the aggregate crypto market cap...
What Are the Most Popular Crypto Indicators in 2026? Which Ones Still Work?
Jun 15,2026 at 04:40pm
RSI: The Enduring Momentum Gauge1. RSI remains one of the most widely adopted indicators across all timeframes, from scalping to position trading. 2. ...
What Is the Aroon Indicator? Can It Help Predict New Trends?
Jun 13,2026 at 01:37am
Market Volatility Patterns1. Bitcoin price swings often exceed 5% within a single trading session during high-liquidity events such as ETF inflow anno...
How to Confirm Trend Reversals Before Entering a Trade?
Jun 12,2026 at 02:39pm
Market Volatility Patterns1. Bitcoin’s price movements often reflect macroeconomic signals such as Federal Reserve interest rate decisions and inflati...
What Is a Volume Spike? Does It Signal a Major Price Move?
Jun 14,2026 at 03:20pm
Understanding Volume Spikes in Cryptocurrency Markets1. A volume spike refers to a sudden and substantial increase in the number of tokens traded with...
How to Use K-Line Indicators During High Volatility Events?
Jun 13,2026 at 11:21pm
K-Line Structure Recognition in Extreme Market Conditions1. A single K-line during high volatility often exhibits abnormally long wicks, indicating ra...
What Is the Best Indicator Combination for Bitcoin Trading?
Jun 13,2026 at 08:20am
BTC.D and Market Phase Recognition1. BTC.D reflects the proportional weight of Bitcoin’s market capitalization against the aggregate crypto market cap...
See all articles


