-
 Bitcoin
 $107,810.8710
-1.45% -
 Ethereum
 $2,531.4386
-1.75% -
 Tether USDt
 $1.0000
-0.03% -
 XRP
XRP $2.2542
-0.99% -
 BNB
BNB $659.1350
-0.50% -
 Solana
 $148.5456
-2.40% -
 USDC
USDC $0.9999
-0.02% -
 TRON
TRON $0.2868
-0.44% -
 Dogecoin
 $0.1666
-3.65% -
 Cardano
 $0.5751
-2.36% -
 Hyperliquid
 $37.6845
-5.51% -
 Bitcoin Cash
 $494.9448
-0.65% -
 Sui
Sui $2.8396
-3.31% -
 Chainlink
 $13.2423
-2.59% -
 UNUS SED LEO
 $9.0482
0.02% -
 Stellar
 $0.2467
-2.44% -
 Avalanche
 $17.8165
-3.63% -
 Shiba Inu
 $0.0...01158
-2.41% -
 Toncoin
 $2.7397
-3.42% -
 Hedera
 $0.1560
-2.73% -
 Litecoin
 $85.8559
-2.34% -
 Monero
 $315.3710
-2.30% -
 Dai
Dai $1.0001
0.00% -
 Polkadot
 $3.3443
-2.03% -
 Ethena USDe
 $1.0001
0.01% -
 Bitget Token
 $4.2888
-3.73% -
 Uniswap
 $7.3388
-1.57% -
 Aave
Aave $278.2986
-3.05% -
 Pepe
Pepe $0.0...09807
-3.67% -
 Pi
Pi $0.4563
-2.39%
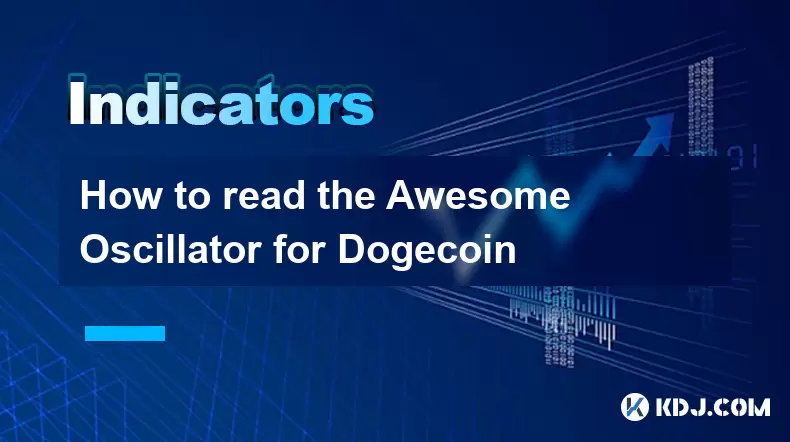
How to read the Awesome Oscillator for Dogecoin
The Awesome Oscillator helps Dogecoin traders gauge momentum shifts by comparing short- and long-term price trends, signaling potential bullish or bearish reversals through histogram patterns like saucers, zero crossovers, and twin peaks.
Jul 08, 2025 at 12:29 am

Understanding the Basics of the Awesome Oscillator
The Awesome Oscillator (AO) is a technical analysis tool used to measure market momentum. It helps traders identify whether the market is bullish or bearish by comparing recent price momentum with broader historical data. For Dogecoin (DOGE), which often experiences volatile movements, the AO can provide insights into potential trend reversals and strength of ongoing trends.
The oscillator is displayed as a histogram that fluctuates above and below a zero line. When the bars are above zero, it indicates that short-term momentum is stronger than long-term momentum, suggesting bullish sentiment. Conversely, when the bars fall below zero, it signals bearish pressure.
To begin reading the Awesome Oscillator for Dogecoin, ensure your charting platform supports this indicator. Popular platforms like TradingView allow you to add it easily from the indicators list. Once applied, the histogram will appear beneath the price chart, providing real-time feedback on Dogecoin’s current momentum dynamics.
Interpreting the Histogram Bars
Each bar in the Awesome Oscillator represents the difference between a 5-period simple moving average (SMA) and a 34-period SMA of the median price (High + Low)/2. The color of the bars provides additional context: green bars indicate increasing momentum compared to the previous bar, while red bars suggest decreasing momentum.
When analyzing Dogecoin, pay close attention to the transitions between green and red bars. A shift from red to green may signal an emerging uptrend, especially if it coincides with other bullish indicators such as rising volume or positive candlestick patterns. On the flip side, consecutive red bars appearing after a series of green ones might warn of weakening buying pressure and a possible reversal.
Also, note how far the bars extend from the zero line. If the Awesome Oscillator reaches high positive values before turning downward, it could suggest overbought conditions. Similarly, deep negative readings followed by a reversal upward may point to oversold levels, potentially setting the stage for a bounce.
Identifying Saucers and Zero Line Crossovers
Two primary patterns to look for when using the Awesome Oscillator for Dogecoin are saucers and zero line crossovers. A saucer pattern occurs when the histogram forms a U-shape, indicating a potential change in direction. A bullish saucer appears when the oscillator moves from positive territory down to negative and then back up, forming a rounded bottom. This suggests that selling pressure has eased and buyers are regaining control.
A bearish saucer is the inverse — the oscillator rises from negative to positive and then curves downward, signaling a loss of bullish momentum. These formations can be particularly useful during sideways or consolidating phases in Dogecoin’s price movement.
Another critical signal is the zero line crossover. When the oscillator crosses from below to above the zero line, it's a bullish sign, implying that short-term momentum has overtaken long-term momentum. Conversely, a move from above to below the zero line indicates bearish dominance. These crossovers should ideally align with price action to increase their reliability.
Recognizing Twin Peaks for Reversal Signals
The Twin Peaks strategy is another method traders use with the Awesome Oscillator to anticipate reversals in Dogecoin's price. This pattern involves two peaks located on the same side of the zero line, with the second peak being lower than the first.
For a bullish Twin Peaks setup, both peaks must be below the zero line. The second dip should not go too far beyond the first but instead form a shallower low. This configuration hints at decreasing selling pressure and a potential upside reversal. Traders typically wait for the oscillator to rise above the valley between the two peaks before considering a long entry.
Conversely, a bearish Twin Peaks scenario happens when two highs occur above the zero line, with the second high being smaller than the first. This implies waning buying momentum and a possible pullback. Again, confirmation comes when the oscillator drops below the trough between the two peaks.
These setups are more effective when combined with other tools such as support/resistance levels or candlestick patterns, especially in highly volatile assets like Dogecoin.
Combining the Awesome Oscillator with Other Indicators
While the Awesome Oscillator offers valuable momentum insights, relying solely on it can lead to false signals, particularly in the unpredictable world of Dogecoin trading. To enhance its accuracy, consider combining it with complementary indicators.
One effective combination is using the Relative Strength Index (RSI) alongside the Awesome Oscillator. RSI can confirm overbought or oversold conditions that the AO might hint at through extreme readings. For example, if the Awesome Oscillator shows a sharp decline below the zero line and RSI dips below 30, it strengthens the case for a potential rebound in Dogecoin.
Another useful pairing is the Moving Average Convergence Divergence (MACD). Both the MACD and the AO assess momentum, but they do so differently. A confluence of signals — such as a bullish crossover in the MACD and a rising AO — increases the probability of a valid trade setup.
Volume indicators like On-Balance Volume (OBV) can also validate momentum shifts detected by the AO. An increase in volume during a bullish AO signal reinforces the likelihood of a sustainable move in Dogecoin's price.
Frequently Asked Questions
Q: Can the Awesome Oscillator be adjusted for different timeframes when trading Dogecoin?
Yes, the Awesome Oscillator settings (default is 5 and 34 periods) can be modified based on your trading timeframe. Shorter timeframes like 1-hour charts may benefit from tighter settings to capture faster momentum shifts in Dogecoin, while longer timeframes like daily charts might require wider settings to filter out noise.
Q: Is the Awesome Oscillator reliable for scalping Dogecoin trades?
While the Awesome Oscillator can provide timely signals, it may generate frequent false alarms on lower timeframes due to increased volatility. Scalpers should combine it with strict risk management and possibly faster-reacting tools like the Stochastic RSI for better precision in Dogecoin scalping strategies.
Q: What should I do if the Awesome Oscillator gives conflicting signals with the price chart for Dogecoin?
Divergences between the Awesome Oscillator and price action can sometimes precede significant reversals in Dogecoin. However, they shouldn’t be acted upon immediately. Wait for additional confirmation such as a candlestick reversal pattern or a breakout of key support/resistance before making a trade decision.
Q: How does the Awesome Oscillator differ from the MACD when analyzing Dogecoin?
The Awesome Oscillator focuses purely on momentum using simple moving averages, whereas the MACD uses exponential moving averages and includes a signal line for crossovers. While both help assess momentum, the AO is simpler and more intuitive for spotting short-term shifts in Dogecoin’s price behavior.
Disclaimer:info@kdj.com
The information provided is not trading advice. kdj.com does not assume any responsibility for any investments made based on the information provided in this article. Cryptocurrencies are highly volatile and it is highly recommended that you invest with caution after thorough research!
If you believe that the content used on this website infringes your copyright, please contact us immediately (info@kdj.com) and we will delete it promptly.
- BlockDAG Leads the Web3 Race with Sports Partnerships and Strategic Pricing
- 2025-07-08 10:50:12
- Pepe, Dogecoin, Shiba Inu: Meme Coin Mania or Calculated Crypto?
- 2025-07-08 10:30:12
- Bitcoin, Ethereum, and Tariff Tussles: Decoding the Crypto Market's Latest Moves
- 2025-07-08 10:30:12
- PEPE, AVAX, Technical Analysis: Riding the Crypto Wave
- 2025-07-08 11:10:12
- BTC Whale's $8.6B Move: Hack, Transfer, or Just a FUD Panic?
- 2025-07-08 11:10:12
- Bitcoin, Treasuries, and the Surge: What's Driving the Market?
- 2025-07-08 11:15:11
Related knowledge

How to trade Dogecoin based on funding rates and open interest
Jul 07,2025 at 02:49am
Understanding Funding Rates in Dogecoin TradingFunding rates are periodic payments made to either long or short traders depending on the prevailing market conditions. In perpetual futures contracts, these rates help align the price of the contract with the spot price of Dogecoin (DOGE). When funding rates are positive, it indicates that long positions p...

What is the 'God Mode' indicator for Bitcoincoin
Jul 07,2025 at 04:42pm
Understanding the 'God Mode' IndicatorThe 'God Mode' indicator is a term that has emerged within cryptocurrency trading communities, particularly those focused on meme coins like Dogecoin (DOGE). While not an officially recognized technical analysis tool or formula, it refers to a set of conditions or patterns in price action and volume that some trader...

Using Gann Fans on the Dogecoin price chart
Jul 07,2025 at 09:43pm
Understanding Gann Fans and Their Relevance in Cryptocurrency TradingGann Fans are a technical analysis tool developed by W.D. Gann, a renowned trader from the early 20th century. These fans consist of diagonal lines that radiate out from a central pivot point on a price chart, typically drawn at specific angles such as 1x1 (45 degrees), 2x1, 1x2, and o...

How to spot manipulation on the Dogecoin chart
Jul 06,2025 at 12:35pm
Understanding the Basics of Chart ManipulationChart manipulation in the cryptocurrency space, particularly with Dogecoin, refers to artificial price movements caused by coordinated trading activities rather than genuine market demand. These manipulations are often executed by large holders (commonly known as whales) or organized groups aiming to mislead...

Bitcoincoin market structure break explained
Jul 07,2025 at 02:51am
Understanding the Dogecoin Market StructureDogecoin, initially created as a meme-based cryptocurrency, has evolved into a significant player in the crypto market. Its market structure refers to how price action is organized over time, including support and resistance levels, trend lines, and patterns that help traders anticipate future movements. A mark...

How to backtest a Dogecoin moving average strategy
Jul 08,2025 at 04:50am
What is a Moving Average Strategy in Cryptocurrency Trading?A moving average strategy is one of the most commonly used technical analysis tools in cryptocurrency trading. It involves analyzing the average price of an asset, such as Dogecoin (DOGE), over a specified time period to identify trends and potential entry or exit points. Traders often use diff...

How to trade Dogecoin based on funding rates and open interest
Jul 07,2025 at 02:49am
Understanding Funding Rates in Dogecoin TradingFunding rates are periodic payments made to either long or short traders depending on the prevailing market conditions. In perpetual futures contracts, these rates help align the price of the contract with the spot price of Dogecoin (DOGE). When funding rates are positive, it indicates that long positions p...

What is the 'God Mode' indicator for Bitcoincoin
Jul 07,2025 at 04:42pm
Understanding the 'God Mode' IndicatorThe 'God Mode' indicator is a term that has emerged within cryptocurrency trading communities, particularly those focused on meme coins like Dogecoin (DOGE). While not an officially recognized technical analysis tool or formula, it refers to a set of conditions or patterns in price action and volume that some trader...

Using Gann Fans on the Dogecoin price chart
Jul 07,2025 at 09:43pm
Understanding Gann Fans and Their Relevance in Cryptocurrency TradingGann Fans are a technical analysis tool developed by W.D. Gann, a renowned trader from the early 20th century. These fans consist of diagonal lines that radiate out from a central pivot point on a price chart, typically drawn at specific angles such as 1x1 (45 degrees), 2x1, 1x2, and o...

How to spot manipulation on the Dogecoin chart
Jul 06,2025 at 12:35pm
Understanding the Basics of Chart ManipulationChart manipulation in the cryptocurrency space, particularly with Dogecoin, refers to artificial price movements caused by coordinated trading activities rather than genuine market demand. These manipulations are often executed by large holders (commonly known as whales) or organized groups aiming to mislead...

Bitcoincoin market structure break explained
Jul 07,2025 at 02:51am
Understanding the Dogecoin Market StructureDogecoin, initially created as a meme-based cryptocurrency, has evolved into a significant player in the crypto market. Its market structure refers to how price action is organized over time, including support and resistance levels, trend lines, and patterns that help traders anticipate future movements. A mark...

How to backtest a Dogecoin moving average strategy
Jul 08,2025 at 04:50am
What is a Moving Average Strategy in Cryptocurrency Trading?A moving average strategy is one of the most commonly used technical analysis tools in cryptocurrency trading. It involves analyzing the average price of an asset, such as Dogecoin (DOGE), over a specified time period to identify trends and potential entry or exit points. Traders often use diff...
See all articles


