-
 Bitcoin
 $108,708.8110
0.60% -
 Ethereum
 $2,561.6057
1.91% -
 Tether USDt
 $1.0001
-0.03% -
 XRP
XRP $2.2795
0.57% -
 BNB
BNB $662.2393
1.00% -
 Solana
 $153.1346
3.74% -
 USDC
USDC $1.0000
0.00% -
 TRON
TRON $0.2877
0.97% -
 Dogecoin
 $0.1710
3.93% -
 Cardano
 $0.5871
1.61% -
 Hyperliquid
 $39.6663
1.68% -
 Sui
Sui $2.9032
0.79% -
 Bitcoin Cash
 $496.1879
1.71% -
 Chainlink
 $13.5807
3.01% -
 UNUS SED LEO
 $9.0777
0.61% -
 Stellar
 $0.2514
4.51% -
 Avalanche
 $18.1761
1.86% -
 Shiba Inu
 $0.0...01173
1.72% -
 Toncoin
 $2.8010
-4.23% -
 Hedera
 $0.1594
3.21% -
 Litecoin
 $87.0257
-0.53% -
 Monero
 $319.1217
1.79% -
 Polkadot
 $3.3853
0.68% -
 Dai
Dai $0.9999
-0.01% -
 Ethena USDe
 $1.0003
0.02% -
 Bitget Token
 $4.3420
-0.97% -
 Uniswap
 $7.3772
1.39% -
 Aave
Aave $286.6277
5.61% -
 Pepe
Pepe $0.0...09994
2.33% -
 Pi
Pi $0.4589
1.76%
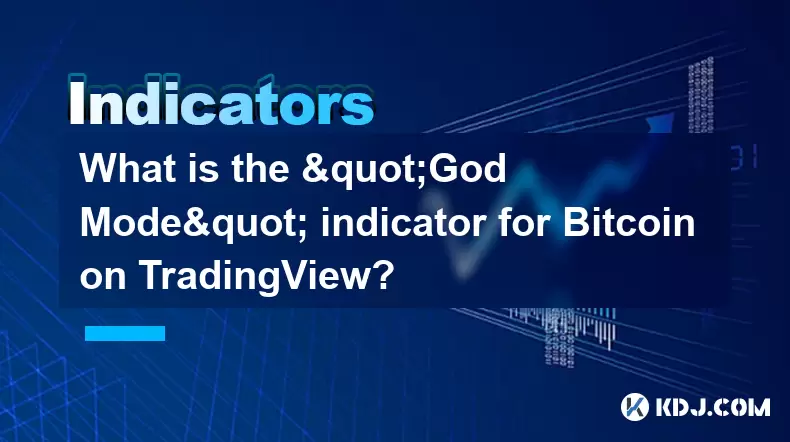
What is the "God Mode" indicator for Bitcoin on TradingView?
The "God Mode" indicator on TradingView combines tools like RSI, moving averages, and volume to help Bitcoin traders spot trends and reversals.
Jul 07, 2025 at 05:56 pm

Understanding the "God Mode" Indicator
The "God Mode" indicator for Bitcoin on TradingView is a term that has gained popularity within the cryptocurrency trading community. It refers to a specific technical analysis tool or strategy that some traders believe provides an almost omniscient view of Bitcoin's price direction. While not an official TradingView feature, it typically combines multiple indicators into one overlay, offering insights into overbought and oversold conditions, trend strength, and potential reversal zones.
This indicator often includes components like moving averages, Relative Strength Index (RSI), and volume metrics. The idea behind its name is that when activated on a chart, it gives traders a near-"god-like" ability to predict market movements with high accuracy. However, it’s important to understand that no single indicator can guarantee 100% accurate predictions in the volatile crypto market.
How to Find and Add the God Mode Indicator on TradingView
To locate and use the God Mode indicator, users must navigate through TradingView's public script library. Here's how you can add it to your Bitcoin chart:
- Open your preferred Bitcoin chart on TradingView.
- Click on the “Indicators” button located at the top of the chart window.
- In the search bar, type keywords like “God Mode” or “Bitcoin God Mode.”
- Look for scripts published by reputable developers or well-known analysts in the crypto space.
- Once found, click “Add to Chart” to apply the indicator.
It’s crucial to verify the source before adding any third-party script. Always check user reviews, comments, and whether the developer is verified on TradingView. Some versions may come with additional settings that allow customization based on personal trading strategies.
Key Features of the God Mode Indicator
The God Mode indicator typically integrates several analytical tools into one comprehensive package. Common features include:
- Trend Arrows: These appear above or below candlesticks to signal potential bullish or bearish trends.
- RSI Overlays: These show momentum and help identify overbought (>70) or oversold (<30) levels.
- Volume Indicators: Highlighting sudden spikes or drops in volume which can precede price changes.
- Moving Averages: Often including combinations like EMA (Exponential Moving Average) and SMA (Simple Moving Average) to filter out noise.
- Heatmaps or Color Zones: Visual cues indicating support/resistance areas or volatility clusters.
These elements work together to create a holistic view of Bitcoin’s current state in the market. Each component contributes unique signals that, when interpreted collectively, may enhance decision-making for both novice and experienced traders.
Interpreting Signals from the God Mode Indicator
Understanding how to interpret the God Mode indicator requires some familiarity with technical analysis principles. For instance, if the RSI portion shows an overbought condition while trend arrows begin pointing downward, this could suggest an imminent pullback. Conversely, a sharp increase in volume accompanied by bullish arrows might indicate a strong upward move.
Traders should also pay attention to confluence zones where multiple indicators align. If the price approaches a key moving average and the heatmap lights up green, this area may act as a strong support level. However, false signals are common in highly volatile markets like Bitcoin, so it's advisable to cross-reference with other tools or strategies before making trades.
Customizing the God Mode Indicator Settings
Most versions of the God Mode indicator come with customizable parameters. To adjust settings:
- Right-click on the chart and select “Format Indicators.”
- Locate the God Mode entry in the list and click the gear icon next to it.
- Modify values such as RSI period length, moving average types, or sensitivity thresholds.
- Apply changes and observe how adjustments affect the indicator’s behavior across different timeframes.
Some traders prefer smoother signals and may increase the RSI period from 14 to 21. Others might tweak moving average lengths to better suit short-term scalping versus long-term holding strategies. Experimentation is key to finding the optimal setup that fits individual risk tolerance and trading style.
Risks and Limitations of Using God Mode
Despite its appeal, the God Mode indicator is not without risks. One major limitation is its reliance on historical data, which may not always reflect future outcomes. Additionally, since it's a composite of multiple indicators, lagging signals can occur during rapid market shifts.
Another concern is overfitting—some versions may perform exceptionally well in backtests but fail in live markets due to curve-fitting bias. Users should avoid relying solely on this tool and instead incorporate fundamental analysis, order flow data, and macroeconomic factors into their decision-making process.
Frequently Asked Questions
Q: Is the God Mode indicator available for free on TradingView?
A: Yes, most versions of the God Mode indicator are freely accessible on TradingView. However, some premium versions created by independent developers may require a subscription or purchase.
Q: Can I use the God Mode indicator for altcoins too?
A: While originally designed for Bitcoin, many traders adapt the God Mode indicator for other cryptocurrencies. Adjustments may be necessary depending on the asset’s volatility and liquidity.
Q: How reliable is the God Mode indicator compared to standard tools like MACD or Bollinger Bands?
A: The God Mode indicator aims to combine the strengths of various tools into one. However, its reliability depends heavily on market conditions and should be used alongside other analyses rather than as a standalone solution.
Q: Do professional traders use the God Mode indicator?
A: Some professionals do utilize multi-indicator overlays similar to the God Mode concept, though they often develop proprietary versions. Many rely more on institutional-grade tools and order book analytics instead.
Disclaimer:info@kdj.com
The information provided is not trading advice. kdj.com does not assume any responsibility for any investments made based on the information provided in this article. Cryptocurrencies are highly volatile and it is highly recommended that you invest with caution after thorough research!
If you believe that the content used on this website infringes your copyright, please contact us immediately (info@kdj.com) and we will delete it promptly.
- E-Load Super Blast: Sri Lanka's Prize Bonanza!
- 2025-07-08 02:30:13
- Pepe, Blockchain, and Presales: What's the Hype?
- 2025-07-08 03:50:17
- Crypto VC, DeFi Liquidity, and Kuru Labs: What's the Buzz?
- 2025-07-08 02:50:12
- Bitcoin Value, Strategy, and Tax Hit: Decoding MicroStrategy's Q2 2025 Triumph
- 2025-07-08 02:30:13
- Bitcoin Price, ETF Experts, and Crypto Trades: Will Bitcoin Hit $150K?
- 2025-07-08 03:55:13
- Ozak AI Presale: The AI Token Race to $1 and Beyond
- 2025-07-08 00:30:13
Related knowledge

How to trade Dogecoin based on funding rates and open interest
Jul 07,2025 at 02:49am
Understanding Funding Rates in Dogecoin TradingFunding rates are periodic payments made to either long or short traders depending on the prevailing market conditions. In perpetual futures contracts, these rates help align the price of the contract with the spot price of Dogecoin (DOGE). When funding rates are positive, it indicates that long positions p...

What is the 'God Mode' indicator for Bitcoincoin
Jul 07,2025 at 04:42pm
Understanding the 'God Mode' IndicatorThe 'God Mode' indicator is a term that has emerged within cryptocurrency trading communities, particularly those focused on meme coins like Dogecoin (DOGE). While not an officially recognized technical analysis tool or formula, it refers to a set of conditions or patterns in price action and volume that some trader...

Using Gann Fans on the Dogecoin price chart
Jul 07,2025 at 09:43pm
Understanding Gann Fans and Their Relevance in Cryptocurrency TradingGann Fans are a technical analysis tool developed by W.D. Gann, a renowned trader from the early 20th century. These fans consist of diagonal lines that radiate out from a central pivot point on a price chart, typically drawn at specific angles such as 1x1 (45 degrees), 2x1, 1x2, and o...

How to spot manipulation on the Dogecoin chart
Jul 06,2025 at 12:35pm
Understanding the Basics of Chart ManipulationChart manipulation in the cryptocurrency space, particularly with Dogecoin, refers to artificial price movements caused by coordinated trading activities rather than genuine market demand. These manipulations are often executed by large holders (commonly known as whales) or organized groups aiming to mislead...

Bitcoincoin market structure break explained
Jul 07,2025 at 02:51am
Understanding the Dogecoin Market StructureDogecoin, initially created as a meme-based cryptocurrency, has evolved into a significant player in the crypto market. Its market structure refers to how price action is organized over time, including support and resistance levels, trend lines, and patterns that help traders anticipate future movements. A mark...

What is the significance of a Dogecoin engulfing candle pattern
Jul 06,2025 at 06:36am
Understanding the Engulfing Candle Pattern in CryptocurrencyThe engulfing candle pattern is a significant technical analysis tool used by traders to identify potential trend reversals in financial markets, including cryptocurrencies like Dogecoin. This pattern typically consists of two candles: the first one is relatively small and indicates the current...

How to trade Dogecoin based on funding rates and open interest
Jul 07,2025 at 02:49am
Understanding Funding Rates in Dogecoin TradingFunding rates are periodic payments made to either long or short traders depending on the prevailing market conditions. In perpetual futures contracts, these rates help align the price of the contract with the spot price of Dogecoin (DOGE). When funding rates are positive, it indicates that long positions p...

What is the 'God Mode' indicator for Bitcoincoin
Jul 07,2025 at 04:42pm
Understanding the 'God Mode' IndicatorThe 'God Mode' indicator is a term that has emerged within cryptocurrency trading communities, particularly those focused on meme coins like Dogecoin (DOGE). While not an officially recognized technical analysis tool or formula, it refers to a set of conditions or patterns in price action and volume that some trader...

Using Gann Fans on the Dogecoin price chart
Jul 07,2025 at 09:43pm
Understanding Gann Fans and Their Relevance in Cryptocurrency TradingGann Fans are a technical analysis tool developed by W.D. Gann, a renowned trader from the early 20th century. These fans consist of diagonal lines that radiate out from a central pivot point on a price chart, typically drawn at specific angles such as 1x1 (45 degrees), 2x1, 1x2, and o...

How to spot manipulation on the Dogecoin chart
Jul 06,2025 at 12:35pm
Understanding the Basics of Chart ManipulationChart manipulation in the cryptocurrency space, particularly with Dogecoin, refers to artificial price movements caused by coordinated trading activities rather than genuine market demand. These manipulations are often executed by large holders (commonly known as whales) or organized groups aiming to mislead...

Bitcoincoin market structure break explained
Jul 07,2025 at 02:51am
Understanding the Dogecoin Market StructureDogecoin, initially created as a meme-based cryptocurrency, has evolved into a significant player in the crypto market. Its market structure refers to how price action is organized over time, including support and resistance levels, trend lines, and patterns that help traders anticipate future movements. A mark...

What is the significance of a Dogecoin engulfing candle pattern
Jul 06,2025 at 06:36am
Understanding the Engulfing Candle Pattern in CryptocurrencyThe engulfing candle pattern is a significant technical analysis tool used by traders to identify potential trend reversals in financial markets, including cryptocurrencies like Dogecoin. This pattern typically consists of two candles: the first one is relatively small and indicates the current...
See all articles


