-
 Bitcoin
 $120300
1.24% -
 Ethereum
 $4311
2.06% -
 XRP
XRP $3.197
0.16% -
 Tether USDt
 $1.000
0.01% -
 BNB
BNB $805.1
0.34% -
 Solana
 $179.6
-1.14% -
 USDC
USDC $0.9998
0.00% -
 Dogecoin
 $0.2303
-1.21% -
 TRON
TRON $0.3442
1.08% -
 Cardano
 $0.7938
-1.23% -
 Hyperliquid
 $44.55
-0.69% -
 Chainlink
 $21.81
-2.59% -
 Stellar
 $0.4436
0.05% -
 Sui
Sui $3.728
-3.42% -
 Bitcoin Cash
 $586.5
2.00% -
 Hedera
 $0.2530
-2.62% -
 Ethena USDe
 $1.001
-0.02% -
 Avalanche
 $23.65
-1.46% -
 Litecoin
 $124.5
-0.71% -
 Toncoin
 $3.384
1.63% -
 UNUS SED LEO
 $9.001
-0.44% -
 Shiba Inu
 $0.00001321
-2.42% -
 Uniswap
 $10.87
-2.31% -
 Polkadot
 $3.956
-2.80% -
 Cronos
 $0.1681
4.79% -
 Dai
Dai $1.000
-0.01% -
 Ethena
 $0.8090
1.30% -
 Bitget Token
 $4.425
-0.55% -
 Monero
 $272.6
3.08% -
 Pepe
Pepe $0.00001169
-2.54%
What do you think when a small positive line rebounds without volume in a downward trend? A signal of a trap to lure more people?
A small positive line rebounding without volume in a downward crypto trend may signal a trap, luring traders into expecting a reversal that doesn't last.
Jun 07, 2025 at 08:07 am
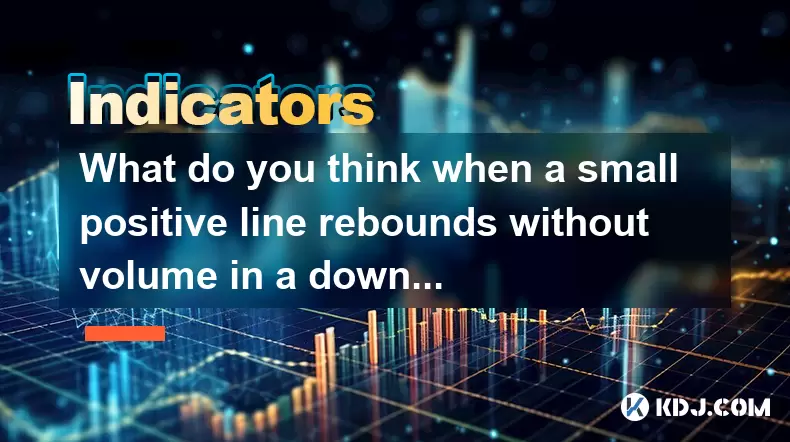
When analyzing a small positive line that rebounds without volume in a downward trend within the cryptocurrency market, it's crucial to understand the potential implications and signals this pattern might convey. A small positive line refers to a slight increase in price, typically represented by a short candlestick on a price chart. Rebounding without volume means that this price increase occurs without a corresponding increase in trading volume, which is often a key indicator of market interest and participation.
In the context of a downward trend, where prices are generally decreasing, a small positive line can be intriguing. It might suggest a temporary halt or a minor reversal in the ongoing trend. However, the absence of volume during this rebound is significant. Volume is a measure of how much of a cryptocurrency is being traded over a period, and it can provide insights into the strength or weakness of a price movement. A rebound without volume might indicate a lack of conviction among traders and investors, suggesting that the upward movement could be fleeting and not supported by broad market interest.
The idea of this pattern being a signal of a trap to lure more people is a common concern in the cryptocurrency market. A trap, often referred to as a "bull trap" in this scenario, is a false signal that suggests a reversal in a trend, enticing traders to enter positions based on the expectation of a continued upward movement. When the price subsequently falls back into the downward trend, those who entered the market based on the false signal can incur losses.
To better understand this phenomenon, let's delve deeper into the specifics of this pattern and its implications.
Analyzing the Small Positive Line
A small positive line in a downward trend can be identified on a candlestick chart as a candle with a small body, indicating a minor increase in price. The key characteristics to look for are:
- The size of the candle: It should be relatively small compared to other candles in the trend.
- The position within the trend: It occurs after a series of declining candles.
- The absence of volume: The trading volume during this candle should be lower than the average volume seen during the trend.
The Role of Volume in Price Movements
Volume plays a critical role in confirming price movements. High volume during a price increase suggests strong market participation and can indicate a more sustainable move. Conversely, low volume during a price increase might suggest a lack of conviction, as fewer traders are participating in the movement.
In the case of a small positive line rebounding without volume, the absence of increased trading activity can be a red flag. It suggests that the upward movement is not being supported by a significant number of traders, which can undermine the sustainability of the price increase.
Identifying a Potential Trap
A trap, or a bull trap in this context, can be identified by several factors:
- The small positive line: It acts as the initial signal that might attract traders expecting a reversal.
- The lack of volume: This is a critical indicator that the movement may not be supported.
- The subsequent price action: If the price quickly falls back into the downward trend, it confirms the trap.
Traders need to be cautious and look for additional confirmation before acting on such signals. Waiting for volume confirmation or looking for other technical indicators that might support the reversal can help avoid falling into a trap.
Psychological Impact on Traders
The psychological impact of a small positive line rebounding without volume can be significant. Traders who are bearish on the market might see this as a confirmation of their views, reinforcing their belief in the ongoing downward trend. Bullish traders, on the other hand, might be tempted to enter the market based on the hope of a reversal, only to be disappointed when the price resumes its decline.
Understanding the psychological dynamics at play can help traders make more informed decisions. It's important to remain disciplined and not let emotions drive trading decisions, especially in the face of potential traps.
Strategies to Avoid Falling into a Trap
To avoid falling into a trap, traders can employ several strategies:
- Wait for confirmation: Look for additional signals that support the reversal, such as increased volume or other technical indicators.
- Use stop-loss orders: Setting stop-loss orders can help limit potential losses if the price does fall back into the downward trend.
- Analyze the broader market context: Consider the overall market sentiment and other factors that might influence the cryptocurrency's price.
By adopting these strategies, traders can better navigate the complexities of the market and make more informed decisions.
Case Studies of Small Positive Lines and Traps
Examining real-world examples can provide valuable insights into how these patterns play out in the market. Let's consider a hypothetical scenario involving a popular cryptocurrency like Bitcoin (BTC).
- Scenario 1: During a prolonged downward trend, Bitcoin experiences a small positive line with no significant increase in volume. Some traders interpret this as a sign of an impending reversal and enter long positions. However, the price quickly resumes its decline, trapping those who bought in at the higher price.
- Scenario 2: Another small positive line occurs, but this time it is accompanied by a noticeable increase in volume. Traders who waited for this confirmation are more confident in the potential reversal and enter positions accordingly. The price continues to rise, validating their decision.
These case studies illustrate the importance of volume and the potential for traps in the market. Traders must be vigilant and use all available tools to make informed decisions.
Frequently Asked Questions
Q1: How can I differentiate between a genuine reversal and a trap?
A1: To differentiate between a genuine reversal and a trap, look for confirmation from other technical indicators and an increase in trading volume. A genuine reversal will typically be accompanied by strong volume and other signs of market interest, such as positive sentiment in the broader market.
Q2: What other technical indicators can help confirm a reversal?
A2: Other technical indicators that can help confirm a reversal include moving averages, relative strength index (RSI), and MACD (Moving Average Convergence Divergence). These indicators can provide additional insights into the strength and direction of a price movement.
Q3: How important is volume in cryptocurrency trading?
A3: Volume is extremely important in cryptocurrency trading as it provides insights into market participation and the strength of price movements. High volume during a price increase suggests strong market interest and can indicate a more sustainable move, while low volume might suggest a lack of conviction.
Q4: Can small positive lines without volume be bullish in any context?
A4: Small positive lines without volume are generally not considered bullish, as they lack the market participation needed to sustain a price increase. However, in some cases, they might be part of a larger pattern or trend that could eventually lead to a bullish outcome, but traders should look for additional confirmation before acting on such signals.
Disclaimer:info@kdj.com
The information provided is not trading advice. kdj.com does not assume any responsibility for any investments made based on the information provided in this article. Cryptocurrencies are highly volatile and it is highly recommended that you invest with caution after thorough research!
If you believe that the content used on this website infringes your copyright, please contact us immediately (info@kdj.com) and we will delete it promptly.
- Token Security, Agentic AI, Cybersecurity Guide: Navigating the New Frontier
- 2025-08-11 23:00:12
- Crypto Investments: Riding the Meme Wave with Layer Brett and Dogecoin
- 2025-08-11 23:00:12
- Nexchain, Crypto Presales, and Bitcoin Volumes: What's the Buzz?
- 2025-08-11 23:10:13
- Ethereum Treasury, Bitcoin, and Michael Saylor: A NYC Take on the Crypto Landscape
- 2025-08-11 23:10:13
- Pumpfun vs. Pepe Dollar: The Meme Coin Arena Heats Up
- 2025-08-11 23:10:14
- Altcoins Primed for a Bull Run: Investment Gains in the Making
- 2025-08-11 23:10:14
Related knowledge
What does it mean when the +DI and -DI cross frequently in the DMI indicator but the ADX is flattening?
Aug 11,2025 at 03:15am
Understanding the DMI Indicator ComponentsThe Directional Movement Index (DMI) is a technical analysis tool composed of three lines: the +DI (Positive...
What does it mean when the moving average, MACD, and RSI all send buy signals simultaneously?
Aug 11,2025 at 01:42pm
Understanding the Convergence of Technical IndicatorsWhen the moving average, MACD, and RSI all generate buy signals at the same time, traders interpr...
What does it mean when the price is trading above the SAR indicator but the red dots are densely packed?
Aug 09,2025 at 11:49pm
Understanding the SAR Indicator and Its Visual SignalsThe SAR (Parabolic Stop and Reverse) indicator is a technical analysis tool used primarily to de...
What does it mean when the RSI indicator moves sideways for an extended period between 40 and 60?
Aug 10,2025 at 08:08am
Understanding the RSI Indicator in Cryptocurrency TradingThe Relative Strength Index (RSI) is a momentum oscillator widely used in cryptocurrency trad...
What does it mean when the MACD histogram continues to shorten but the price reaches a new high?
Aug 09,2025 at 09:29pm
Understanding the MACD Histogram and Its ComponentsThe MACD (Moving Average Convergence Divergence) indicator is a widely used technical analysis tool...
What does it mean when the Triple Moving Average (TRIX) turns downward but the price doesn't fall?
Aug 09,2025 at 12:42pm
Understanding the Triple Moving Average (TRIX) IndicatorThe Triple Moving Average, commonly known as TRIX, is a momentum oscillator designed to filter...

What does it mean when the +DI and -DI cross frequently in the DMI indicator but the ADX is flattening?
Aug 11,2025 at 03:15am
Understanding the DMI Indicator ComponentsThe Directional Movement Index (DMI) is a technical analysis tool composed of three lines: the +DI (Positive...

What does it mean when the moving average, MACD, and RSI all send buy signals simultaneously?
Aug 11,2025 at 01:42pm
Understanding the Convergence of Technical IndicatorsWhen the moving average, MACD, and RSI all generate buy signals at the same time, traders interpr...

What does it mean when the price is trading above the SAR indicator but the red dots are densely packed?
Aug 09,2025 at 11:49pm
Understanding the SAR Indicator and Its Visual SignalsThe SAR (Parabolic Stop and Reverse) indicator is a technical analysis tool used primarily to de...

What does it mean when the RSI indicator moves sideways for an extended period between 40 and 60?
Aug 10,2025 at 08:08am
Understanding the RSI Indicator in Cryptocurrency TradingThe Relative Strength Index (RSI) is a momentum oscillator widely used in cryptocurrency trad...

What does it mean when the MACD histogram continues to shorten but the price reaches a new high?
Aug 09,2025 at 09:29pm
Understanding the MACD Histogram and Its ComponentsThe MACD (Moving Average Convergence Divergence) indicator is a widely used technical analysis tool...

What does it mean when the Triple Moving Average (TRIX) turns downward but the price doesn't fall?
Aug 09,2025 at 12:42pm
Understanding the Triple Moving Average (TRIX) IndicatorThe Triple Moving Average, commonly known as TRIX, is a momentum oscillator designed to filter...
See all articles


