-
 Bitcoin
 $117500
1.38% -
 Ethereum
 $3753
3.41% -
 XRP
XRP $3.156
1.94% -
 Tether USDt
 $1.000
-0.01% -
 BNB
BNB $782.5
2.66% -
 Solana
 $186.3
4.36% -
 USDC
USDC $1.000
-0.02% -
 Dogecoin
 $0.2379
4.64% -
 TRON
TRON $0.3177
1.24% -
 Cardano
 $0.8267
2.65% -
 Hyperliquid
 $44.40
5.58% -
 Stellar
 $0.4455
6.46% -
 Sui
Sui $4.004
9.56% -
 Chainlink
 $18.41
4.95% -
 Hedera
 $0.2681
12.63% -
 Bitcoin Cash
 $555.0
5.47% -
 Avalanche
 $24.13
3.94% -
 Litecoin
 $113.6
3.07% -
 Shiba Inu
 $0.00001410
5.62% -
 UNUS SED LEO
 $8.978
0.00% -
 Toncoin
 $3.329
7.72% -
 Ethena USDe
 $1.001
-0.01% -
 Uniswap
 $10.53
6.18% -
 Polkadot
 $4.115
4.44% -
 Monero
 $323.8
-3.70% -
 Dai
Dai $1.000
0.01% -
 Bitget Token
 $4.580
2.83% -
 Pepe
Pepe $0.00001258
4.49% -
 Aave
Aave $297.9
3.98% -
 Cronos
 $0.1338
6.28%
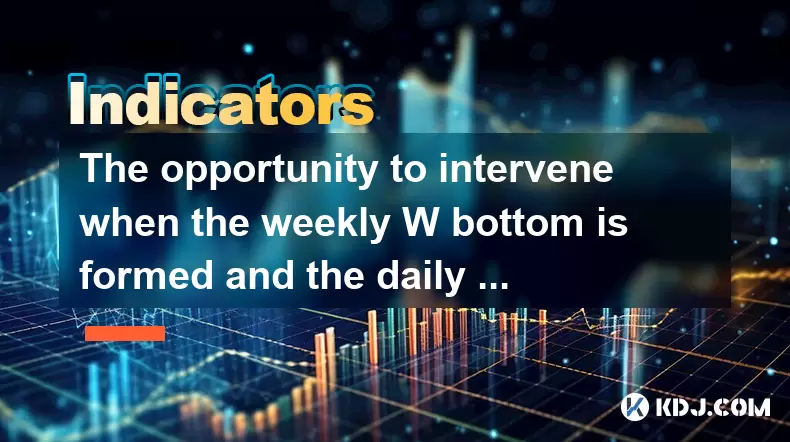
The opportunity to intervene when the weekly W bottom is formed and the daily MACD golden cross is superimposed
A confirmed W bottom on the weekly chart combined with a daily MACD golden cross signals a high-probability bullish reversal, especially when supported by volume and on-chain data.
Jul 25, 2025 at 04:22 pm
Understanding the W Bottom Formation in Weekly Charts
The W bottom is a reversal pattern commonly observed in technical analysis, particularly on weekly timeframes. This pattern is characterized by two distinct lows at approximately the same price level, separated by a moderate rally, forming a "W" shape. When this pattern appears on a weekly chart, it often signals a potential shift from a bearish to a bullish trend. The confirmation of the W bottom occurs when the price breaks above the intermediate high—the peak between the two lows—on strong volume.
Traders watch for this pattern because it reflects market sentiment shifting from selling pressure to accumulation. The first bottom represents panic or capitulation, while the second bottom indicates reduced selling interest, suggesting that bears are losing control. The rally following the second bottom, especially if it surpasses the intermediate high, confirms buyer dominance. In the context of cryptocurrencies, which are highly volatile, spotting a confirmed W bottom on the weekly chart can offer a high-probability entry zone.
It's essential to validate the pattern with volume analysis. A noticeable increase in trading volume during the breakout confirms the legitimacy of the reversal. Without volume confirmation, the formation may be a false signal. Additionally, aligning this pattern with broader market conditions—such as positive macroeconomic developments or improving on-chain metrics—can enhance the reliability of the signal.
Interpreting the Daily MACD Golden Cross
The MACD (Moving Average Convergence Divergence) is a momentum oscillator that helps identify trend changes. A golden cross on the MACD occurs when the MACD line (typically the 12-day EMA minus the 26-day EMA) crosses above the signal line (9-day EMA of the MACD line). When this happens on the daily chart, it suggests increasing bullish momentum and potential acceleration in price.
For cryptocurrency traders, the daily MACD golden cross serves as a timing tool. While the weekly W bottom indicates a structural shift, the daily golden cross provides a tactical entry signal. The combination of both increases the probability of a successful trade. The golden cross is more reliable when it occurs after a prolonged downtrend and is accompanied by rising volume.
To properly set up the MACD indicator on a crypto trading platform:
- Navigate to the charting interface.
- Select the daily timeframe.
- Add the MACD indicator from the studies or indicators menu.
- Ensure the default settings are 12, 26, 9 unless customized.
- Observe the histogram turning from red to green as the crossover occurs.
Traders should wait for the MACD line to remain above the signal line for at least one full candle to avoid false signals. Also, monitoring the histogram’s height can indicate the strength of the momentum—taller green bars suggest stronger bullish pressure.
Synchronizing Weekly and Daily Signals for Entry
When the weekly W bottom is confirmed and the daily MACD golden cross appears, the alignment of timeframes creates a compelling intervention opportunity. The weekly pattern provides the strategic context—a major trend reversal—while the daily signal offers precise timing. This multi-timeframe confluence is highly regarded in technical trading.
To execute this strategy:
- Identify the completion of the W bottom by confirming the price closes above the intermediate high on the weekly chart.
- Switch to the daily chart and wait for the MACD golden cross to occur.
- Ensure that the golden cross happens near or after the second bottom of the W pattern.
- Check for supporting indicators such as RSI moving above 50 or bullish candlestick patterns like hammer or engulfing.
Entry can be initiated at the close of the daily candle where the golden cross forms. A stop-loss can be placed slightly below the second bottom of the W pattern to manage risk. Position sizing should account for volatility, especially in cryptocurrencies where price swings are common.
This synchronization reduces the likelihood of entering during a temporary bounce. The weekly structure ensures the move isn't just noise, while the daily momentum confirms active buying interest.
Managing Risk and Position Size
Even with strong technical signals, risk management remains critical. Cryptocurrency markets are prone to sharp reversals and manipulation. Therefore, defining risk parameters before entering a trade is essential.
Consider the following steps:
- Determine the distance between entry and stop-loss level.
- Calculate position size so that no more than 1-2% of total capital is at risk per trade.
- Use a limit order to enter at the desired price, avoiding slippage during volatile periods.
- Avoid leveraging heavily, as margin can amplify losses during false breakouts.
For example, if entering Bitcoin at $60,000 with a stop-loss at $57,500 (below the second bottom), the risk per coin is $2,500. With a $10,000 account and 1% risk tolerance ($100), the position size would be 0.04 BTC. This disciplined approach preserves capital for future opportunities.
Additionally, monitor order book depth and liquidity. Low liquidity can cause large price gaps, making stop-loss execution less reliable. Exchanges with high volume and tight spreads are preferable for executing such strategies.
Validating the Setup with On-Chain and Sentiment Data
While technical patterns are powerful, combining them with on-chain metrics and sentiment analysis enhances decision-making. For instance, a W bottom forming alongside increasing exchange outflows may indicate accumulation by long-term holders. Similarly, declining exchange reserves often precede bullish moves.
Key on-chain indicators to review:
- Network Value to Transactions (NVT) ratio: A declining NVT suggests the network is becoming more valuable relative to transaction volume, often bullish.
- HODL wave: Increasing percentages of coins held for 155+ days signal reduced selling pressure.
- Social dominance and fear & greed index: A shift from extreme fear to neutral sentiment can confirm a bottom.
Platforms like Glassnode or Santiment provide these metrics. Cross-referencing technical signals with fundamental on-chain health adds confidence. For example, if the W bottom and MACD cross occur while large wallets are accumulating, the setup gains credibility.
Frequently Asked Questions
What if the MACD golden cross occurs before the W bottom is confirmed?
Wait for the W bottom to be confirmed—i.e., price must close above the intermediate high on the weekly chart. An early golden cross may reflect a dead cat bounce, not a structural reversal.
Can this strategy be applied to altcoins?
Yes, but with caution. Altcoins often lack consistent volume and are more susceptible to manipulation. Ensure the altcoin has sufficient liquidity and a clear chart history before applying this method.
How long should I hold after entering on this signal?
There is no fixed duration. Monitor price action and momentum. Exit signals include a daily MACD death cross, breakdown below key support, or overbought RSI on higher timeframes.
Is it necessary to use leverage when this pattern appears?
No. Leverage is not required and increases risk. Given the volatility of crypto assets, trading with spot capital and proper position sizing is safer and more sustainable.
Disclaimer:info@kdj.com
The information provided is not trading advice. kdj.com does not assume any responsibility for any investments made based on the information provided in this article. Cryptocurrencies are highly volatile and it is highly recommended that you invest with caution after thorough research!
If you believe that the content used on this website infringes your copyright, please contact us immediately (info@kdj.com) and we will delete it promptly.
- UAE's Digital Asset Revolution: Stablecoin Regulations Take Center Stage
- 2025-07-26 10:40:11
- VIRTUAL Weekly Drop: Recovery Analysis and Privacy Push
- 2025-07-26 08:50:11
- Bitcoin, Cynthia Lummis, and Freedom Money: A New Yorker's Take
- 2025-07-26 08:30:11
- Pudgy Penguins, Crypto Prices, and the Altseason Buzz: What's the Hype?
- 2025-07-26 10:51:48
- Crypto Gainers, Top 10, Week 30: Altcoins Buck the Trend
- 2025-07-26 08:55:12
- Solana, Altcoins, and Coinbase: What's the Buzz?
- 2025-07-26 06:30:12
Related knowledge

What does it mean that the rebound is blocked after the moving average is arranged in a short position for the first time?
Jul 26,2025 at 10:51am
Understanding the Short-Term Moving Average ConfigurationWhen traders refer to a 'short position arrangement' in moving averages, they are describing ...

What does it mean when the price rises along the 5-day moving average for five consecutive days?
Jul 26,2025 at 08:07am
Understanding the 5-Day Moving Average in Cryptocurrency TradingThe 5-day moving average (5DMA) is a widely used technical indicator in cryptocurrency...

What does it mean when the price breaks through the 60-day moving average with a large volume but shrinks the next day?
Jul 26,2025 at 06:01am
Understanding the 60-Day Moving Average in Cryptocurrency TradingThe 60-day moving average (60DMA) is a widely used technical indicator in the cryptoc...
What does it mean when OBV continues to hit new highs but the price is stagnant?
Jul 26,2025 at 09:57am
Understanding the On-Balance Volume (OBV) IndicatorThe On-Balance Volume (OBV) is a technical analysis indicator that uses volume flow to predict chan...
What does the golden cross of EMA12 and EMA26 but the low trading volume reflect?
Jul 26,2025 at 06:44am
Understanding the Golden Cross in EMA12 and EMA26The golden cross is a widely recognized technical indicator in the cryptocurrency market, signaling a...
What does it mean when the price breaks through the 30-day moving average and is accompanied by a large volume?
Jul 26,2025 at 03:35am
Understanding the 30-Day Moving Average in Cryptocurrency TradingThe 30-day moving average (MA) is a widely used technical indicator in the cryptocurr...

What does it mean that the rebound is blocked after the moving average is arranged in a short position for the first time?
Jul 26,2025 at 10:51am
Understanding the Short-Term Moving Average ConfigurationWhen traders refer to a 'short position arrangement' in moving averages, they are describing ...

What does it mean when the price rises along the 5-day moving average for five consecutive days?
Jul 26,2025 at 08:07am
Understanding the 5-Day Moving Average in Cryptocurrency TradingThe 5-day moving average (5DMA) is a widely used technical indicator in cryptocurrency...

What does it mean when the price breaks through the 60-day moving average with a large volume but shrinks the next day?
Jul 26,2025 at 06:01am
Understanding the 60-Day Moving Average in Cryptocurrency TradingThe 60-day moving average (60DMA) is a widely used technical indicator in the cryptoc...

What does it mean when OBV continues to hit new highs but the price is stagnant?
Jul 26,2025 at 09:57am
Understanding the On-Balance Volume (OBV) IndicatorThe On-Balance Volume (OBV) is a technical analysis indicator that uses volume flow to predict chan...

What does the golden cross of EMA12 and EMA26 but the low trading volume reflect?
Jul 26,2025 at 06:44am
Understanding the Golden Cross in EMA12 and EMA26The golden cross is a widely recognized technical indicator in the cryptocurrency market, signaling a...

What does it mean when the price breaks through the 30-day moving average and is accompanied by a large volume?
Jul 26,2025 at 03:35am
Understanding the 30-Day Moving Average in Cryptocurrency TradingThe 30-day moving average (MA) is a widely used technical indicator in the cryptocurr...
See all articles


