


-
 bitcoin
 $87959.907984 USD
1.34% - ethereum
$2920.497338 USD
3.04% - tether
$0.999775 USD
0.00% - xrp
$2.237324 USD
8.12% - bnb
$860.243768 USD
0.90% - solana
$138.089498 USD
5.43% - usd-coin
$0.999807 USD
0.01% - tron
$0.272801 USD
-1.53% - dogecoin
$0.150904 USD
2.96% - cardano
$0.421635 USD
1.97% - hyperliquid
$32.152445 USD
2.23% - bitcoin-cash
$533.301069 USD
-1.94% - chainlink
$12.953417 USD
2.68% - unus-sed-leo
$9.535951 USD
0.73% - zcash
$521.483386 USD
-2.87%


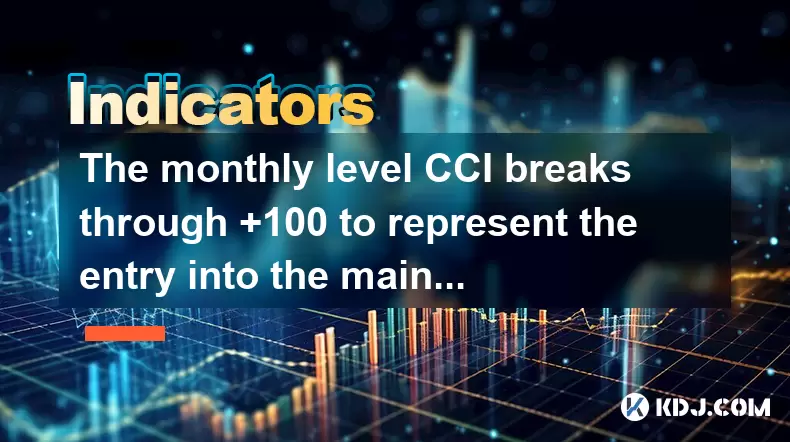
The monthly level CCI breaks through +100 to represent the entry into the main rising wave?
When Bitcoin's monthly CCI breaks above +100, it signals strong bullish momentum and potential start of a main rising wave, often leading to significant price gains.
Jun 30, 2025 at 01:50 am
Understanding the Commodity Channel Index (CCI) in Cryptocurrency Trading
The Commodity Channel Index (CCI) is a momentum oscillator widely used by cryptocurrency traders to identify overbought and oversold conditions, as well as potential trend reversals. Originally developed for commodities, it has been adapted effectively for digital assets due to their volatile nature. The CCI oscillates above and below a zero line, with typical values ranging from -100 to +100. When the monthly level of CCI breaks through +100, many traders interpret this as a strong bullish signal.
In the context of cryptocurrencies like Bitcoin or Ethereum, such a breakout could suggest that the market has entered into a powerful upward movement, often referred to as a main rising wave. This concept originates from Elliott Wave theory, which identifies recurring price patterns driven by investor psychology.
What Does It Mean When Monthly CCI Breaks Above +100?
A monthly CCI reading exceeding +100 indicates that the asset is experiencing strong upward momentum across a long-term time frame. In technical analysis, crossing above +100 suggests that the current price is significantly higher than the average price over the past period, signaling intense buying pressure.
For example, if Bitcoin’s monthly CCI rises above +100, it may imply that institutional adoption or macroeconomic factors have catalyzed a new phase of growth. This kind of signal is particularly valuable in crypto markets, where trends can persist for months before reversing.
Traders often combine this information with other indicators such as moving averages or volume profiles to confirm the strength of the emerging trend. However, it's crucial to note that while the monthly CCI breaking +100 is a compelling indicator, it should not be used in isolation.
How to Interpret the Main Rising Wave Concept in Crypto Markets
The term 'main rising wave' comes from Elliott Wave Theory, which posits that financial markets move in repetitive cycles of five waves in the direction of the main trend followed by three corrective waves. The third wave, known as the main rising wave, is typically the strongest and most extended.
In cryptocurrency trading, identifying the main rising wave can help investors capture large moves with relatively low risk. A monthly CCI breakout above +100 may coincide with the start of this powerful wave, especially after a prolonged consolidation or bearish phase.
This scenario is often accompanied by increasing media attention, positive regulatory developments, or major technological upgrades within the blockchain ecosystem. These factors contribute to sustained demand and can propel prices higher for weeks or even months.
Step-by-Step Guide to Confirming a Main Rising Wave Using Monthly CCI
To determine whether a cryptocurrency is entering a main rising wave based on monthly CCI, follow these steps:
- Access the monthly chart: Open your preferred trading platform and switch to the monthly time frame.
- Add the CCI indicator: Locate the Commodity Channel Index in the indicators menu and apply it to the chart.
- Set the period to default (usually 14): Most platforms use a 14-period setting, which is sufficient for long-term analysis.
- Observe CCI crossing above +100: Look for a candlestick where the CCI value moves above the +100 threshold.
- Check for confluence with other signals: Confirm the breakout with tools like the Relative Strength Index (RSI), MACD, or volume spikes.
- Monitor price action post-breakout: Ensure that prices continue to rise in the following weeks to validate the trend.
By following this process, traders can filter out false signals and focus on high-probability setups aligned with the broader market sentiment.
Historical Examples of Monthly CCI Breakouts in Cryptocurrencies
Several notable instances in crypto history demonstrate how a monthly CCI breakout above +100 coincided with significant bull runs. For instance, during late 2020, Bitcoin’s monthly CCI crossed +100 around November, shortly before its meteoric rise to nearly $65,000 in April 2021. Similarly, Ethereum saw a similar pattern ahead of its all-time highs in May 2021.
These examples illustrate that when combined with fundamental catalysts and improving on-chain metrics, the monthly CCI crossing +100 can serve as a reliable early warning system for major price movements.
It's important to study historical data to understand how different cryptocurrencies react to such technical levels. Some altcoins may exhibit more volatility, leading to frequent false breakouts, while major coins like BTC or ETH tend to produce more reliable signals.
Frequently Asked Questions (FAQ)
Q: Can the CCI indicator be adjusted for cryptocurrency volatility?Yes, although the default setting is usually 14 periods, some traders adjust the CCI to higher values (e.g., 20 or 30) to smooth out readings in highly volatile crypto markets. However, doing so may delay the signal.
Q: Is a monthly CCI breakout always followed by a main rising wave?No, while a monthly CCI breakout above +100 increases the likelihood of a strong rally, it doesn't guarantee one. Market conditions, news events, and macroeconomic factors can override technical signals.
Q: Should I enter a trade immediately after the monthly CCI breaks +100?Not necessarily. It’s advisable to wait for confirmation through subsequent price action or additional indicators. Entering too early can expose you to false breakouts, especially in thinly traded or illiquid altcoins.
Q: How does the monthly CCI compare to weekly or daily CCI in importance?The monthly CCI provides a broader perspective on long-term momentum compared to shorter time frames. While daily or weekly signals are useful for timing entries, the monthly CCI helps identify the dominant trend direction.
Disclaimer:info@kdj.com
The information provided is not trading advice. kdj.com does not assume any responsibility for any investments made based on the information provided in this article. Cryptocurrencies are highly volatile and it is highly recommended that you invest with caution after thorough research!
If you believe that the content used on this website infringes your copyright, please contact us immediately (info@kdj.com) and we will delete it promptly.


- Bitcoin, eCash Fork, and Airdrop Dynamics: A Deep Dive into Crypto's Latest Controversies
- 2026-05-03 12:55:01
- Consensus 2026 Miami: Web3, Blockchain, Cryptocurrency, NFTs, Metaverse, Conference, May 5th — Where Wall Street Meets the Digital Frontier
- 2026-05-02 12:45:01
- Fed Holds Rates Steady, Triggering Bitcoin Price Drop Amidst Geopolitical Tensions
- 2026-05-01 06:45:01
- Bitcoin Miners Electrify the Grid: Ohio Gas Plant Acquisition Powers Up a New Era for Digital Gold
- 2026-05-01 00:45:01
- MegaETH's MEGA Token Hits the Big Apple: Setting New Performance Benchmarks for Real-Time Blockchain
- 2026-05-01 00:55:01
- Solana's Slippery Slope: Price Prediction Points to Resistance Loss and Potential Further Drops
- 2026-05-01 06:45:01
Related knowledge

What Is Crypto Top Indicator? Which Signals Show a Market Peak?
Jul 30,2026 at 06:59pm
Understanding Crypto Top Indicators1. Crypto top indicators are statistical tools designed to identify exhaustion points in upward price momentum befo...

What Is Crypto Bottom Indicator? How Do Traders Identify Market Lows?
Jul 21,2026 at 08:20am
Bitcoin Halving Mechanics1. Bitcoin’s protocol enforces a fixed issuance schedule where block rewards are cut in half approximately every 210,000 bloc...

What Is Crypto Trend Reversal Indicator? Which Signals Should You Watch?
Jul 24,2026 at 11:00am
Market Volatility Patterns1. Bitcoin price swings often exceed 5% within a single 24-hour window during high-liquidity events such as ETF inflow annou...

What Is Weekly Bitcoin Chart Indicator? Can It Predict Long-Term Trends?
Jul 22,2026 at 07:39am
Market Volatility Patterns1. Price swings in cryptocurrency markets often exceed 10% within a 24-hour window, driven by liquidity constraints and algo...

What Is Daily K Line Indicator? How Do You Analyze Daily Trends?
Jul 29,2026 at 09:06pm
Market Volatility Patterns1. Bitcoin price swings often exceed 10% within a 24-hour window during high-liquidity events such as ETF approval announcem...

What Is 4 Hour Chart Indicator? Why Do Crypto Traders Use It?
Jul 23,2026 at 02:20pm
Market Volatility Patterns1. Bitcoin price swings often exceed 10% within a 24-hour window during high-liquidity events such as ETF approval announcem...
What Is Crypto Top Indicator? Which Signals Show a Market Peak?
Jul 30,2026 at 06:59pm
Understanding Crypto Top Indicators1. Crypto top indicators are statistical tools designed to identify exhaustion points in upward price momentum befo...
What Is Crypto Bottom Indicator? How Do Traders Identify Market Lows?
Jul 21,2026 at 08:20am
Bitcoin Halving Mechanics1. Bitcoin’s protocol enforces a fixed issuance schedule where block rewards are cut in half approximately every 210,000 bloc...
What Is Crypto Trend Reversal Indicator? Which Signals Should You Watch?
Jul 24,2026 at 11:00am
Market Volatility Patterns1. Bitcoin price swings often exceed 5% within a single 24-hour window during high-liquidity events such as ETF inflow annou...
What Is Weekly Bitcoin Chart Indicator? Can It Predict Long-Term Trends?
Jul 22,2026 at 07:39am
Market Volatility Patterns1. Price swings in cryptocurrency markets often exceed 10% within a 24-hour window, driven by liquidity constraints and algo...
What Is Daily K Line Indicator? How Do You Analyze Daily Trends?
Jul 29,2026 at 09:06pm
Market Volatility Patterns1. Bitcoin price swings often exceed 10% within a 24-hour window during high-liquidity events such as ETF approval announcem...
What Is 4 Hour Chart Indicator? Why Do Crypto Traders Use It?
Jul 23,2026 at 02:20pm
Market Volatility Patterns1. Bitcoin price swings often exceed 10% within a 24-hour window during high-liquidity events such as ETF approval announcem...
See all articles


