-
 Bitcoin
 $108,708.8110
0.60% -
 Ethereum
 $2,561.6057
1.91% -
 Tether USDt
 $1.0001
-0.03% -
 XRP
XRP $2.2795
0.57% -
 BNB
BNB $662.2393
1.00% -
 Solana
 $153.1346
3.74% -
 USDC
USDC $1.0000
0.00% -
 TRON
TRON $0.2877
0.97% -
 Dogecoin
 $0.1710
3.93% -
 Cardano
 $0.5871
1.61% -
 Hyperliquid
 $39.6663
1.68% -
 Sui
Sui $2.9032
0.79% -
 Bitcoin Cash
 $496.1879
1.71% -
 Chainlink
 $13.5807
3.01% -
 UNUS SED LEO
 $9.0777
0.61% -
 Stellar
 $0.2514
4.51% -
 Avalanche
 $18.1761
1.86% -
 Shiba Inu
 $0.0...01173
1.72% -
 Toncoin
 $2.8010
-4.23% -
 Hedera
 $0.1594
3.21% -
 Litecoin
 $87.0257
-0.53% -
 Monero
 $319.1217
1.79% -
 Polkadot
 $3.3853
0.68% -
 Dai
Dai $0.9999
-0.01% -
 Ethena USDe
 $1.0003
0.02% -
 Bitget Token
 $4.3420
-0.97% -
 Uniswap
 $7.3772
1.39% -
 Aave
Aave $286.6277
5.61% -
 Pepe
Pepe $0.0...09994
2.33% -
 Pi
Pi $0.4589
1.76%
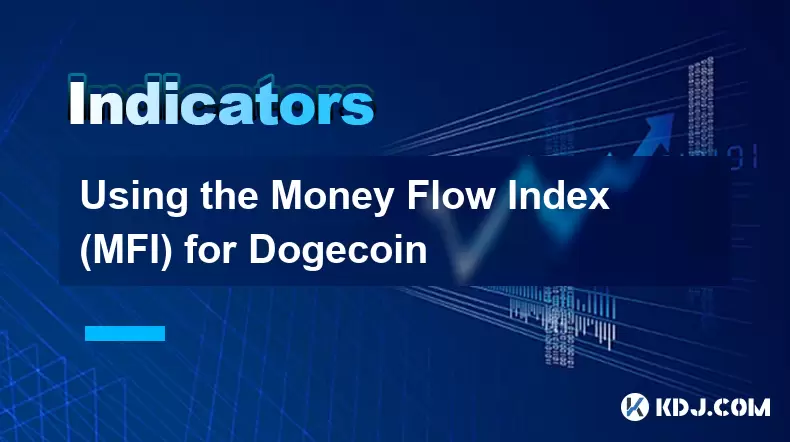
Using the Money Flow Index (MFI) for Dogecoin
The Money Flow Index (MFI) helps Dogecoin traders gauge buying or selling pressure by combining price and volume data, signaling overbought or oversold conditions.
Jul 07, 2025 at 06:00 pm

Understanding the Money Flow Index (MFI) in Cryptocurrency Analysis
The Money Flow Index (MFI) is a technical indicator used to measure the flow of money into or out of an asset over a specific period, typically 14 days. In the context of Dogecoin trading, MFI helps assess buying and selling pressure by incorporating both price and volume data. Unlike traditional oscillators that rely solely on price, MFI uses volume-weighted metrics to provide a more comprehensive view of market sentiment.
Key components of MFI include typical price calculation, raw money flow, and the money ratio. These elements combine to form a value that ranges from 0 to 100. When applied to Dogecoin, traders can identify potential overbought or oversold conditions, which may signal upcoming trend reversals or continuation patterns.
How to Calculate the MFI for Dogecoin
To apply the MFI to Dogecoin, begin by calculating the typical price for each trading day. This is derived using the formula:
Typical Price = (High + Low + Close) / 3Next, determine the raw money flow, which is the product of the typical price and the trading volume for that day:
Raw Money Flow = Typical Price × VolumeAfter gathering this data for a 14-day period, compare each day’s typical price with the previous day’s. If today’s typical price is higher than yesterday’s, it indicates positive money flow; if lower, it’s negative. Summing these values gives the positive and negative money flows respectively.
Then compute the money ratio:
Money Ratio = Positive Money Flow / Negative Money FlowFinally, calculate the MFI using the following formula:
MFI = 100 – [100 / (1 + Money Ratio)]This final value will help determine whether Dogecoin is experiencing strong accumulation or distribution.
Interpreting MFI Levels for Dogecoin Trading Signals
Once you’ve calculated the MFI, interpreting its levels becomes crucial for decision-making. Generally, an MFI above 80 suggests overbought conditions, implying that Dogecoin might be overvalued and due for a pullback. Conversely, an MFI below 20 signals oversold territory, indicating possible undervaluation and a potential rebound.
However, it’s important not to act solely based on these thresholds. Confirming the MFI readings with other indicators like Relative Strength Index (RSI) or Moving Averages can enhance the reliability of the signals. For instance, if Dogecoin shows an MFI reading above 80 while RSI also reflects overbought status, the likelihood of a correction increases.
Another critical aspect is divergence analysis. If Dogecoin’s price makes new highs but the MFI fails to do so, it could suggest weakening momentum and a potential reversal.
Applying MFI in Real-Time Dogecoin Charts
When applying MFI to real-time Dogecoin charts, choose a reliable trading platform such as TradingView, Binance, or CoinMarketCap Pro. Most platforms offer built-in MFI indicators that automatically plot the oscillator beneath the price chart.
- Navigate to the Dogecoin chart
- Locate the indicator section and search for “Money Flow Index”
- Set the period to 14 (default setting)
- Apply the indicator to the chart
Now, observe how the MFI line fluctuates between 0 and 100. Pay attention to instances where the MFI crosses above 80 or drops below 20. These are key zones to monitor for potential entry or exit points.
Also, look for divergences between the MFI and the Dogecoin price movement. For example, if the price climbs steadily but the MFI forms lower peaks, it may indicate waning buyer enthusiasm.
Combining MFI with Other Tools for Enhanced Accuracy
While MFI offers valuable insights, combining it with other tools enhances its effectiveness in Dogecoin trading. Consider integrating volume analysis, support/resistance levels, and moving average crossovers alongside MFI signals.
For instance, if Dogecoin approaches a known resistance level and the MFI simultaneously reaches overbought territory, the confluence strengthens the case for a short-term pullback. Similarly, during a downtrend, if the MFI hits oversold levels near a historical support zone, it could signal a bounce.
Additionally, using candlestick patterns in conjunction with MFI readings can improve timing precision. A bullish engulfing pattern forming when MFI is below 20 may present a high-probability long opportunity.
Avoid relying solely on MFI for trade decisions. Always cross-reference with other confirmatory signals to reduce false positives and increase trade accuracy.
Common Pitfalls to Avoid When Using MFI for Dogecoin
One common mistake traders make is assuming that reaching overbought or oversold levels guarantees an immediate reversal. In reality, markets can remain overbought or oversold for extended periods, especially during strong trends.
Another pitfall is ignoring market news or macroeconomic factors affecting Dogecoin. Sudden announcements related to regulatory changes, exchange listings, or celebrity endorsements can cause sharp price swings that may distort MFI readings temporarily.
Lastly, failing to adjust the MFI period according to volatility can lead to misleading signals. During high volatility phases, consider shortening the MFI period (e.g., to 7 or 10 days) for faster responses to changing conditions.
Always backtest your strategy using historical Dogecoin data before deploying real capital. This allows you to understand how MFI behaves under different market environments and fine-tune your approach accordingly.
Frequently Asked Questions
Q: Can I use MFI for short-term Dogecoin trading?
Yes, MFI can be adapted for intraday or swing trading by adjusting the time frame. Shorter periods like 7 or 10 days may yield quicker signals suitable for active traders.
Q: Does MFI work better on certain exchanges for Dogecoin?
MFI performance isn’t tied to any specific exchange. However, using platforms with high liquidity and accurate volume data ensures more reliable MFI calculations.
Q: How does MFI differ from RSI when analyzing Dogecoin?
While both are oscillators, MFI incorporates volume, making it more sensitive to shifts in buying or selling pressure. RSI only considers price changes and may miss subtle shifts in volume-driven trends.
Q: Should I always wait for MFI to reach 80 or 20 before acting?
Not necessarily. Some traders prefer entering positions earlier based on divergences or trendline breaks. Waiting for extreme levels can sometimes result in missed opportunities or late entries.
Disclaimer:info@kdj.com
The information provided is not trading advice. kdj.com does not assume any responsibility for any investments made based on the information provided in this article. Cryptocurrencies are highly volatile and it is highly recommended that you invest with caution after thorough research!
If you believe that the content used on this website infringes your copyright, please contact us immediately (info@kdj.com) and we will delete it promptly.
- E-Load Super Blast: Sri Lanka's Prize Bonanza!
- 2025-07-08 02:30:13
- Pepe, Blockchain, and Presales: What's the Hype?
- 2025-07-08 03:50:17
- Crypto VC, DeFi Liquidity, and Kuru Labs: What's the Buzz?
- 2025-07-08 02:50:12
- Bitcoin Value, Strategy, and Tax Hit: Decoding MicroStrategy's Q2 2025 Triumph
- 2025-07-08 02:30:13
- Bitcoin Price, ETF Experts, and Crypto Trades: Will Bitcoin Hit $150K?
- 2025-07-08 03:55:13
- Ozak AI Presale: The AI Token Race to $1 and Beyond
- 2025-07-08 00:30:13
Related knowledge

How to trade Dogecoin based on funding rates and open interest
Jul 07,2025 at 02:49am
Understanding Funding Rates in Dogecoin TradingFunding rates are periodic payments made to either long or short traders depending on the prevailing market conditions. In perpetual futures contracts, these rates help align the price of the contract with the spot price of Dogecoin (DOGE). When funding rates are positive, it indicates that long positions p...

What is the 'God Mode' indicator for Bitcoincoin
Jul 07,2025 at 04:42pm
Understanding the 'God Mode' IndicatorThe 'God Mode' indicator is a term that has emerged within cryptocurrency trading communities, particularly those focused on meme coins like Dogecoin (DOGE). While not an officially recognized technical analysis tool or formula, it refers to a set of conditions or patterns in price action and volume that some trader...

Using Gann Fans on the Dogecoin price chart
Jul 07,2025 at 09:43pm
Understanding Gann Fans and Their Relevance in Cryptocurrency TradingGann Fans are a technical analysis tool developed by W.D. Gann, a renowned trader from the early 20th century. These fans consist of diagonal lines that radiate out from a central pivot point on a price chart, typically drawn at specific angles such as 1x1 (45 degrees), 2x1, 1x2, and o...

How to spot manipulation on the Dogecoin chart
Jul 06,2025 at 12:35pm
Understanding the Basics of Chart ManipulationChart manipulation in the cryptocurrency space, particularly with Dogecoin, refers to artificial price movements caused by coordinated trading activities rather than genuine market demand. These manipulations are often executed by large holders (commonly known as whales) or organized groups aiming to mislead...

Bitcoincoin market structure break explained
Jul 07,2025 at 02:51am
Understanding the Dogecoin Market StructureDogecoin, initially created as a meme-based cryptocurrency, has evolved into a significant player in the crypto market. Its market structure refers to how price action is organized over time, including support and resistance levels, trend lines, and patterns that help traders anticipate future movements. A mark...

How to backtest a Dogecoin moving average strategy
Jul 08,2025 at 04:50am
What is a Moving Average Strategy in Cryptocurrency Trading?A moving average strategy is one of the most commonly used technical analysis tools in cryptocurrency trading. It involves analyzing the average price of an asset, such as Dogecoin (DOGE), over a specified time period to identify trends and potential entry or exit points. Traders often use diff...

How to trade Dogecoin based on funding rates and open interest
Jul 07,2025 at 02:49am
Understanding Funding Rates in Dogecoin TradingFunding rates are periodic payments made to either long or short traders depending on the prevailing market conditions. In perpetual futures contracts, these rates help align the price of the contract with the spot price of Dogecoin (DOGE). When funding rates are positive, it indicates that long positions p...

What is the 'God Mode' indicator for Bitcoincoin
Jul 07,2025 at 04:42pm
Understanding the 'God Mode' IndicatorThe 'God Mode' indicator is a term that has emerged within cryptocurrency trading communities, particularly those focused on meme coins like Dogecoin (DOGE). While not an officially recognized technical analysis tool or formula, it refers to a set of conditions or patterns in price action and volume that some trader...

Using Gann Fans on the Dogecoin price chart
Jul 07,2025 at 09:43pm
Understanding Gann Fans and Their Relevance in Cryptocurrency TradingGann Fans are a technical analysis tool developed by W.D. Gann, a renowned trader from the early 20th century. These fans consist of diagonal lines that radiate out from a central pivot point on a price chart, typically drawn at specific angles such as 1x1 (45 degrees), 2x1, 1x2, and o...

How to spot manipulation on the Dogecoin chart
Jul 06,2025 at 12:35pm
Understanding the Basics of Chart ManipulationChart manipulation in the cryptocurrency space, particularly with Dogecoin, refers to artificial price movements caused by coordinated trading activities rather than genuine market demand. These manipulations are often executed by large holders (commonly known as whales) or organized groups aiming to mislead...

Bitcoincoin market structure break explained
Jul 07,2025 at 02:51am
Understanding the Dogecoin Market StructureDogecoin, initially created as a meme-based cryptocurrency, has evolved into a significant player in the crypto market. Its market structure refers to how price action is organized over time, including support and resistance levels, trend lines, and patterns that help traders anticipate future movements. A mark...

How to backtest a Dogecoin moving average strategy
Jul 08,2025 at 04:50am
What is a Moving Average Strategy in Cryptocurrency Trading?A moving average strategy is one of the most commonly used technical analysis tools in cryptocurrency trading. It involves analyzing the average price of an asset, such as Dogecoin (DOGE), over a specified time period to identify trends and potential entry or exit points. Traders often use diff...
See all articles


