


![[Updated Season 3] Watched all 3 seasons in one go🔥The reborn monk has only ten years left to live, and is ostracized and exiled by the vicious sect | MULTI SUB](/uploads/2026/07/04/cryptocurrencies-news/videos/origin_6a488802d38c4_image_500_375.webp "[Updated Season 3] Watched all 3 seasons in one go🔥The reborn monk has only ten years left to live, and is ostracized and exiled by the vicious sect | MULTI SUB")


-
 bitcoin
 $87959.907984 USD
1.34% - ethereum
$2920.497338 USD
3.04% - tether
$0.999775 USD
0.00% - xrp
$2.237324 USD
8.12% - bnb
$860.243768 USD
0.90% - solana
$138.089498 USD
5.43% - usd-coin
$0.999807 USD
0.01% - tron
$0.272801 USD
-1.53% - dogecoin
$0.150904 USD
2.96% - cardano
$0.421635 USD
1.97% - hyperliquid
$32.152445 USD
2.23% - bitcoin-cash
$533.301069 USD
-1.94% - chainlink
$12.953417 USD
2.68% - unus-sed-leo
$9.535951 USD
0.73% - zcash
$521.483386 USD
-2.87%


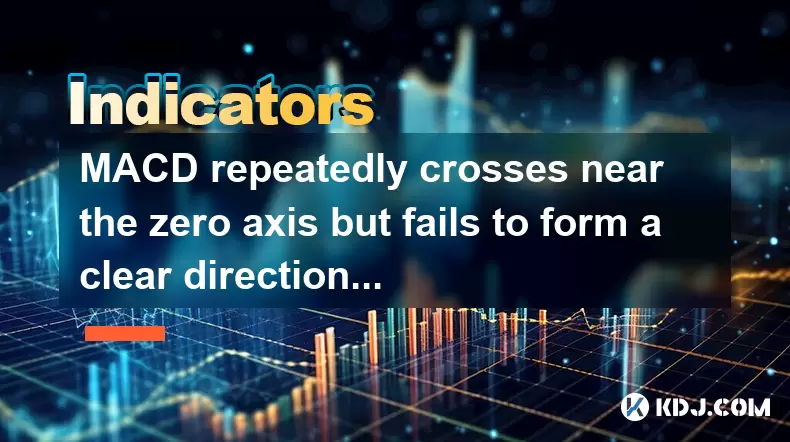
MACD repeatedly crosses near the zero axis but fails to form a clear direction?
When the MACD line repeatedly crosses near the zero axis, it signals market indecision, often seen in crypto during consolidation or before key breakouts.
Jun 24, 2025 at 09:28 am
Understanding MACD Behavior Around the Zero Axis
The Moving Average Convergence Divergence (MACD) is a widely used technical indicator in cryptocurrency trading. It consists of three main components: the MACD line, the signal line, and the histogram. When the MACD line crosses above or below the signal line, it generates buy or sell signals. However, when the MACD repeatedly crosses near the zero axis without forming a clear direction, traders often find themselves confused about the market's next move.
This behavior typically indicates market indecision or consolidation. In crypto markets, where volatility can be extreme, such patterns are common during sideways price movements or before major breakout attempts.
Key Insight: Repeated crossovers near the zero line suggest that neither bulls nor bears are gaining control, which may precede a significant trend reversal or continuation.
What Does the Zero Line Represent?
The zero line in the MACD histogram serves as a critical reference point. When the MACD line is above the zero line, it implies that the short-term moving average is higher than the long-term one, indicating positive momentum. Conversely, if the MACD line is below the zero line, it suggests negative momentum.
When the MACD line hovers around this level, it means that the short-term and long-term averages are nearly equal. This equilibrium often occurs during periods of low volume or lack of news-driven movement in the market.
- The zero line acts as a dividing line between bullish and bearish momentum.
- Frequent crossings suggest weak directional strength.
- This pattern often appears ahead of key support/resistance tests.
Why Does MACD Keep Crossing the Zero Line?
Several factors contribute to this repeated crossing behavior:
- Market Consolidation: Crypto assets often enter consolidation phases after sharp moves. During these times, buyers and sellers balance each other out.
- Low Trading Volume: Reduced participation leads to narrow price ranges and less decisive MACD behavior.
- Absence of Catalysts: Without news events or macroeconomic triggers, the market lacks direction.
- Algorithmic Noise: Short-term trading bots can create false signals that confuse traditional indicators like MACD.
Important Note: The more frequently the MACD crosses the zero line within a short period, the weaker the trend becomes, especially in highly volatile crypto pairs.
How to Interpret These Crossings in Different Market Contexts
Interpreting MACD behavior requires understanding the broader market context. Here’s how you can assess it in different scenarios:
- In Ranging Markets: Frequent zero-line crossings indicate a lack of momentum. Traders should avoid aggressive positions and consider range-bound strategies.
- At Key Support/Resistance Levels: If the price is testing a crucial level and MACD remains neutral, it may signal an impending breakout.
- After Strong Trends: A sudden shift to zero-axis bouncing might mean the current trend is losing steam and a reversal could be near.
It's essential to combine MACD readings with other tools such as volume analysis, order book depth, or support/resistance zones for better accuracy.
Strategies to Trade or Avoid This Pattern
Traders should approach this pattern with caution. Here are some practical strategies:
- Wait for Confirmation: Instead of acting on every crossover, wait for a confirmed break above or below a key level before entering a trade.
- Use Multiple Timeframes: Zoom into lower timeframes (like 15-minute or 1-hour charts) to spot early signs of momentum while using daily charts for context.
- Combine with Other Indicators: Use RSI or Bollinger Bands to confirm whether the asset is overbought or oversold during these neutral MACD phases.
- Avoid Overtrading: Refrain from placing multiple trades based solely on MACD signals in this environment to reduce risk.
Caution: Many novice traders misinterpret these signals and end up buying high and selling low due to premature entries.
Frequently Asked Questions (FAQ)
Can I use MACD effectively in altcoin trading when it keeps crossing the zero line?
Yes, but with limitations. Altcoins tend to be more volatile and prone to false signals. In such cases, aligning your MACD observations with order flow data and exchange-specific metrics can improve decision-making.
Is there a way to filter out false MACD crossovers near the zero line?
Using a volatility filter like the Average True Range (ATR) or confirming with candlestick patterns can help. Only act on MACD signals when they align with stronger price action or volume surges.
Should I ignore all MACD signals when it's bouncing around the zero line?
Not necessarily. You should treat them as inconclusive rather than invalid. Wait for additional confirmation from other sources before making a trade decision.
How does Bitcoin dominance affect MACD behavior across altcoins?
When Bitcoin dominance rises, many altcoins enter consolidation or downtrend phases. This often results in erratic MACD behavior, including frequent zero-line crossings, due to reduced inflows into smaller cryptocurrencies.
Disclaimer:info@kdj.com
The information provided is not trading advice. kdj.com does not assume any responsibility for any investments made based on the information provided in this article. Cryptocurrencies are highly volatile and it is highly recommended that you invest with caution after thorough research!
If you believe that the content used on this website infringes your copyright, please contact us immediately (info@kdj.com) and we will delete it promptly.


- Bitcoin, eCash Fork, and Airdrop Dynamics: A Deep Dive into Crypto's Latest Controversies
- 2026-05-03 12:55:01
- Consensus 2026 Miami: Web3, Blockchain, Cryptocurrency, NFTs, Metaverse, Conference, May 5th — Where Wall Street Meets the Digital Frontier
- 2026-05-02 12:45:01
- Fed Holds Rates Steady, Triggering Bitcoin Price Drop Amidst Geopolitical Tensions
- 2026-05-01 06:45:01
- Bitcoin Miners Electrify the Grid: Ohio Gas Plant Acquisition Powers Up a New Era for Digital Gold
- 2026-05-01 00:45:01
- MegaETH's MEGA Token Hits the Big Apple: Setting New Performance Benchmarks for Real-Time Blockchain
- 2026-05-01 00:55:01
- Solana's Slippery Slope: Price Prediction Points to Resistance Loss and Potential Further Drops
- 2026-05-01 06:45:01
Related knowledge

How does RSI overextension signal potential crypto correction?
Jun 29,2026 at 04:39pm
RSI Overextension Mechanics in Crypto Markets1. RSI values above 70 indicate overbought conditions where buying pressure has exhausted itself across m...

What is stochastic RSI crossover strategy in crypto trading?
Jun 29,2026 at 02:00pm
Stochastic RSI Fundamentals in Cryptocurrency Markets1. Stochastic RSI is derived from the standard RSI but applies stochastic oscillator logic to its...

How does Ichimoku cloud lagging span help crypto analysis?
Jul 03,2026 at 06:59am
Lagging Span Functionality in Crypto Charts1. Chikou Span plots the current closing price shifted backward by 26 periods, anchoring price action to hi...

What does OBV spike reveal about crypto whale activity?
Jun 30,2026 at 01:19am
On-Balance Volume and Whale Accumulation Patterns1. A sharp OBV spike coincides with unusually large inflows into exchange wallets, often preceding su...

How does ATR spike indicate panic selling in crypto markets?
Jun 28,2026 at 03:39pm
ATR Spike as a Real-Time Panic Signal1. The Average True Range (ATR) measures volatility by calculating the average of true ranges over a defined peri...

How does SMA act as psychological level in crypto markets?
Jun 28,2026 at 06:19pm
Psychological Anchoring in Market Sentiment1. Social Media Addiction (SMA) manifests in crypto markets through persistent attention fixation on price ...
How does RSI overextension signal potential crypto correction?
Jun 29,2026 at 04:39pm
RSI Overextension Mechanics in Crypto Markets1. RSI values above 70 indicate overbought conditions where buying pressure has exhausted itself across m...
What is stochastic RSI crossover strategy in crypto trading?
Jun 29,2026 at 02:00pm
Stochastic RSI Fundamentals in Cryptocurrency Markets1. Stochastic RSI is derived from the standard RSI but applies stochastic oscillator logic to its...
How does Ichimoku cloud lagging span help crypto analysis?
Jul 03,2026 at 06:59am
Lagging Span Functionality in Crypto Charts1. Chikou Span plots the current closing price shifted backward by 26 periods, anchoring price action to hi...
What does OBV spike reveal about crypto whale activity?
Jun 30,2026 at 01:19am
On-Balance Volume and Whale Accumulation Patterns1. A sharp OBV spike coincides with unusually large inflows into exchange wallets, often preceding su...
How does ATR spike indicate panic selling in crypto markets?
Jun 28,2026 at 03:39pm
ATR Spike as a Real-Time Panic Signal1. The Average True Range (ATR) measures volatility by calculating the average of true ranges over a defined peri...
How does SMA act as psychological level in crypto markets?
Jun 28,2026 at 06:19pm
Psychological Anchoring in Market Sentiment1. Social Media Addiction (SMA) manifests in crypto markets through persistent attention fixation on price ...
See all articles


