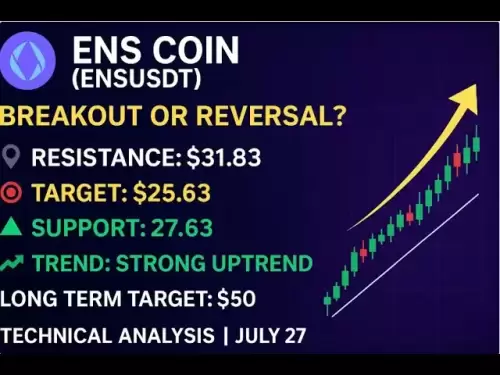
-
 Bitcoin
 $117900
0.31% -
 Ethereum
 $3766
0.28% -
 XRP
XRP $3.176
-0.31% -
 Tether USDt
 $1.000
0.00% -
 BNB
BNB $795.6
1.51% -
 Solana
 $186.8
-1.09% -
 USDC
USDC $0.9999
-0.01% -
 Dogecoin
 $0.2353
-1.33% -
 TRON
TRON $0.3226
1.49% -
 Cardano
 $0.8172
-1.08% -
 Sui
Sui $4.178
3.06% -
 Hyperliquid
 $43.05
-3.39% -
 Stellar
 $0.4367
-0.57% -
 Chainlink
 $18.62
1.47% -
 Hedera
 $0.2828
6.63% -
 Bitcoin Cash
 $584.7
5.65% -
 Avalanche
 $24.81
2.53% -
 Litecoin
 $112.8
-0.88% -
 UNUS SED LEO
 $8.975
-0.08% -
 Shiba Inu
 $0.00001395
-1.07% -
 Toncoin
 $3.285
-1.05% -
 Ethena USDe
 $1.001
0.01% -
 Polkadot
 $4.123
0.76% -
 Uniswap
 $10.49
-0.18% -
 Monero
 $326.5
0.14% -
 Dai
Dai $0.9999
-0.02% -
 Bitget Token
 $4.576
0.34% -
 Pepe
Pepe $0.00001247
-1.55% -
 Cronos
 $0.1400
3.77% -
 Aave
Aave $295.1
-0.73%
How to grasp the rebound buying point of 1-hour RSI oversold + 15-minute Morning Star?
When the 1-hour RSI is below 30 and a 15-minute Morning Star forms, it signals a high-probability bullish reversal with confluence across timeframes.
Jul 27, 2025 at 04:21 am
Understanding the 1-Hour RSI Oversold Condition
The Relative Strength Index (RSI) is a momentum oscillator that measures the speed and change of price movements. When analyzing the 1-hour RSI, traders typically use a 14-period setting to identify overbought or oversold conditions. A reading below 30 on the RSI is generally considered oversold, indicating that the asset may be undervalued and due for a potential upward correction. However, being oversold does not automatically mean a reversal will occur. It merely suggests weakening downward momentum. Traders must confirm this signal with additional technical patterns.
To apply the 1-hour RSI oversold strategy effectively, monitor the RSI on the 1-hour chart consistently. When the RSI drops below 30, note the exact candle where this occurs. It's crucial to wait for the RSI to remain below 30 for at least one full candle close to avoid false signals caused by intracandle spikes. During strong downtrends, the RSI can remain oversold for extended periods, so relying solely on this indicator increases the risk of premature entries. This is why combining it with a candlestick reversal pattern like the Morning Star on a lower timeframe enhances accuracy.
Identifying the 15-Minute Morning Star Pattern
The Morning Star is a bullish reversal candlestick pattern that typically forms at the bottom of a downtrend. It consists of three candles on the 15-minute chart:
- A long bearish (red) candle indicating continued selling pressure.
- A small-bodied candle (either green or red) that gaps down, showing indecision and reduced momentum.
- A long bullish (green) candle that closes well into the body of the first candle, signaling a shift in sentiment.
To validate the Morning Star, ensure the second candle creates a gap down from the close of the first candle. This gap is more common in traditional markets but can still appear in cryptocurrency charts during high volatility. The third candle must show strong buying pressure, ideally closing above the midpoint of the first candle’s body. The smaller the middle candle, the stronger the reversal signal, as it reflects market hesitation before buyers take control.
Traders should draw horizontal lines to mark the low of the middle candle and the close of the third candle. These levels help set stop-loss and take-profit points. The formation must occur after a clear downtrend; otherwise, it lacks context and reliability. The 15-minute Morning Star acts as a micro reversal signal that complements the broader oversold condition seen on the 1-hour RSI.
Aligning Timeframes for Confluence
For the strategy to be effective, confluence between the 1-hour RSI oversold and the 15-minute Morning Star is essential. This means the Morning Star pattern must form while the 1-hour RSI is below 30 or just rebounding from below 30. The ideal scenario occurs when the third candle of the Morning Star closes, and the 1-hour RSI begins to turn upward from the oversold zone.
To monitor this alignment:
- Keep both the 1-hour and 15-minute charts open simultaneously.
- Use charting platforms like TradingView to set up dual-pane views.
- Apply the RSI indicator to the 1-hour chart and visually inspect the 15-minute chart for the Morning Star.
- Confirm that the downtrend on both timeframes is evident before the pattern appears.
When both conditions align, the probability of a short-term bullish reversal increases significantly. This multi-timeframe confirmation reduces false entries and improves risk-reward ratios. The larger timeframe provides context, while the smaller one offers precise entry timing.
Executing the Buy Entry with Precision
Once the 1-hour RSI is oversold and a valid 15-minute Morning Star is confirmed, execute the buy order with the following steps:
- Wait for the third candle of the Morning Star to close completely. Do not enter before the candle closes to avoid fakeouts.
- Place a market order or a limit order slightly above the close of the third candle to ensure execution.
- Set a stop-loss just below the low of the middle candle in the Morning Star pattern. This level represents the point where the reversal fails.
- Define a take-profit target at the nearest resistance level, such as a previous swing high or a Fibonacci retracement level (e.g., 50% or 61.8%).
Use position sizing based on your risk tolerance. For example, risk no more than 1-2% of your trading capital on a single trade. If the stop-loss is 50 pips away, adjust the position size so that the monetary loss does not exceed your risk limit. Leverage should be used cautiously, especially in volatile crypto markets.
Monitoring Post-Entry Price Action
After entering the trade, monitor the subsequent candles on the 15-minute chart for confirmation of momentum. Look for:
- Higher highs and higher lows forming after the entry.
- The 1-hour RSI continuing to rise above 30, ideally crossing into neutral territory (above 50).
- Volume increasing on up-candles, indicating strong buying interest.
If the price moves favorably, consider moving the stop-loss to breakeven once the price reaches 1.5 times the initial risk. This protects capital while allowing the trade to run. Avoid exiting too early based on emotion. Stick to the predefined take-profit or trail the stop using a moving average or recent swing low.
Be alert for signs of reversal failure, such as a large red candle erasing the gains of the third Morning Star candle. In such cases, exit immediately to preserve capital.
Frequently Asked Questions
What if the 15-minute Morning Star forms but the 1-hour RSI is not below 30?
The strategy requires both conditions to align. If the RSI is not oversold, the Morning Star may not indicate a strong reversal. It could be a temporary bounce in a larger downtrend. Only trade when both signals are present.
Can the Morning Star pattern include a doji as the second candle?
Yes, a doji is actually a strong variation of the middle candle. It represents extreme indecision and often precedes a reversal. A doji with small wicks enhances the reliability of the Morning Star.
Is this strategy applicable to all cryptocurrencies?
It works best on highly liquid cryptocurrencies like BTC, ETH, or BNB with sufficient trading volume. Low-cap altcoins may exhibit erratic candlestick patterns and unreliable RSI behavior due to low liquidity and manipulation.
How long should I hold the position after entry?
Hold until the take-profit is hit or the stop-loss is triggered. Do not hold beyond the initial target unless a new trend signal emerges. This is a short-term rebound strategy, not a long-term investment approach.
Disclaimer:info@kdj.com
The information provided is not trading advice. kdj.com does not assume any responsibility for any investments made based on the information provided in this article. Cryptocurrencies are highly volatile and it is highly recommended that you invest with caution after thorough research!
If you believe that the content used on this website infringes your copyright, please contact us immediately (info@kdj.com) and we will delete it promptly.
- Cryptos to Watch in 2025: Punisher Coin, Chainlink, and the Altcoin Arena
- 2025-07-27 18:30:13
- Bitcoin, Altcoins, Rebound: Navigating the Crypto Comeback Trail
- 2025-07-27 18:30:13
- Ethereum, Bitcoin, and Altcoins: A Shift in Crypto Tides?
- 2025-07-27 19:10:13
- Windtree Therapeutics' Bold BNB Strategy: A $520 Million Crypto Play
- 2025-07-27 19:10:13
- Solana, Staking, and Unilabs: What's the Buzz in the Crypto Space?
- 2025-07-27 16:50:13
- VeChain, HBAR, Remittix: Navigating the Crypto Landscape in 2025
- 2025-07-27 17:10:12
Related knowledge

What signal does the ROC send when it rises rapidly from a low level and breaks through the zero axis?
Jul 27,2025 at 10:15am
Understanding the Rate of Change (ROC) IndicatorThe Rate of Change (ROC) is a momentum-based oscillator used in technical analysis to measure the perc...

What does it mean that the rebound is blocked after the moving average is arranged in a short position for the first time?
Jul 26,2025 at 10:51am
Understanding the Short-Term Moving Average ConfigurationWhen traders refer to a 'short position arrangement' in moving averages, they are describing ...

What does it mean that the parabolic indicator and the price break through the previous high at the same time?
Jul 26,2025 at 07:22pm
Understanding the Parabolic Indicator (SAR)The Parabolic SAR (Stop and Reverse) is a technical analysis tool developed by J. Welles Wilder to identify...
What does it mean that the upper and lower tracks of the Bollinger Band open upward at the same time?
Jul 27,2025 at 02:49pm
Understanding the Bollinger Band StructureThe Bollinger Band is a widely used technical analysis tool developed by John Bollinger. It consists of thre...
What does it mean that the price falls below the short-term moving average after the RSI top divergence?
Jul 26,2025 at 11:01pm
Understanding RSI Top Divergence in Cryptocurrency TradingThe Relative Strength Index (RSI) is a momentum oscillator widely used in cryptocurrency tra...
What does it mean when the moving average is arranged in a bullish pattern but the MACD bar is shortened?
Jul 27,2025 at 06:07am
Understanding the Bullish Moving Average PatternWhen traders observe a bullish moving average pattern, they typically refer to a configuration where s...

What signal does the ROC send when it rises rapidly from a low level and breaks through the zero axis?
Jul 27,2025 at 10:15am
Understanding the Rate of Change (ROC) IndicatorThe Rate of Change (ROC) is a momentum-based oscillator used in technical analysis to measure the perc...

What does it mean that the rebound is blocked after the moving average is arranged in a short position for the first time?
Jul 26,2025 at 10:51am
Understanding the Short-Term Moving Average ConfigurationWhen traders refer to a 'short position arrangement' in moving averages, they are describing ...

What does it mean that the parabolic indicator and the price break through the previous high at the same time?
Jul 26,2025 at 07:22pm
Understanding the Parabolic Indicator (SAR)The Parabolic SAR (Stop and Reverse) is a technical analysis tool developed by J. Welles Wilder to identify...

What does it mean that the upper and lower tracks of the Bollinger Band open upward at the same time?
Jul 27,2025 at 02:49pm
Understanding the Bollinger Band StructureThe Bollinger Band is a widely used technical analysis tool developed by John Bollinger. It consists of thre...

What does it mean that the price falls below the short-term moving average after the RSI top divergence?
Jul 26,2025 at 11:01pm
Understanding RSI Top Divergence in Cryptocurrency TradingThe Relative Strength Index (RSI) is a momentum oscillator widely used in cryptocurrency tra...

What does it mean when the moving average is arranged in a bullish pattern but the MACD bar is shortened?
Jul 27,2025 at 06:07am
Understanding the Bullish Moving Average PatternWhen traders observe a bullish moving average pattern, they typically refer to a configuration where s...
See all articles


