-
 Bitcoin
 $107,810.8710
-1.45% -
 Ethereum
 $2,531.4386
-1.75% -
 Tether USDt
 $1.0000
-0.03% -
 XRP
XRP $2.2542
-0.99% -
 BNB
BNB $659.1350
-0.50% -
 Solana
 $148.5456
-2.40% -
 USDC
USDC $0.9999
-0.02% -
 TRON
TRON $0.2868
-0.44% -
 Dogecoin
 $0.1666
-3.65% -
 Cardano
 $0.5751
-2.36% -
 Hyperliquid
 $37.6845
-5.51% -
 Bitcoin Cash
 $494.9448
-0.65% -
 Sui
Sui $2.8396
-3.31% -
 Chainlink
 $13.2423
-2.59% -
 UNUS SED LEO
 $9.0482
0.02% -
 Stellar
 $0.2467
-2.44% -
 Avalanche
 $17.8165
-3.63% -
 Shiba Inu
 $0.0...01158
-2.41% -
 Toncoin
 $2.7397
-3.42% -
 Hedera
 $0.1560
-2.73% -
 Litecoin
 $85.8559
-2.34% -
 Monero
 $315.3710
-2.30% -
 Dai
Dai $1.0001
0.00% -
 Polkadot
 $3.3443
-2.03% -
 Ethena USDe
 $1.0001
0.01% -
 Bitget Token
 $4.2888
-3.73% -
 Uniswap
 $7.3388
-1.57% -
 Aave
Aave $278.2986
-3.05% -
 Pepe
Pepe $0.0...09807
-3.67% -
 Pi
Pi $0.4563
-2.39%
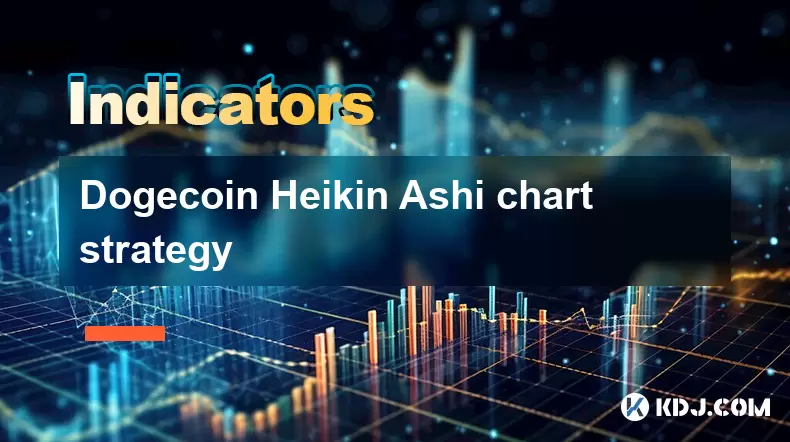
Dogecoin Heikin Ashi chart strategy
The Heikin Ashi chart smooths Dogecoin's price action, helping traders spot trends and reversals by averaging candle data, reducing noise, and filtering false signals in volatile conditions.
Jul 07, 2025 at 11:28 pm

Understanding the Heikin Ashi Chart
The Heikin Ashi chart is a variation of the traditional candlestick chart that helps traders identify trends and potential reversals more clearly. Unlike standard Japanese candlesticks, which use the open, high, low, and close prices directly, Heikin Ashi candles are calculated using averaged values. This smoothing effect makes it easier to spot momentum and filter out market noise.
For Dogecoin (DOGE) traders, applying this chart type can provide clearer visual signals in a highly volatile market. The formula for each candle's components is as follows:
- HA Close = (Open + High + Low + Close) / 4
- HA Open = (HA Open of previous bar + HA Close of previous bar) / 2
- HA High = Maximum of High, HA Open, HA Close
- HA Low = Minimum of Low, HA Open, HA Close
This calculation results in candles that tend to stay red or green during strong trends, making it simpler to assess whether to hold or exit a position.
Why Use Heikin Ashi for Dogecoin Trading?
Dogecoin is known for its unpredictable price swings driven by social media sentiment and meme culture. In such an environment, traditional candlestick charts can often give misleading signals due to sudden spikes and retracements. The Heikin Ashi chart, with its averaging mechanism, reduces false signals and provides a smoother representation of price action.
When applied to DOGE, the Heikin Ashi technique allows traders to better gauge trend strength and possible reversal points. For instance, a series of green candles indicates bullish dominance, while red candles suggest bearish pressure. Traders can combine this with volume indicators or moving averages to confirm trend direction and entry points.
Setting Up the Heikin Ashi Chart on Trading Platforms
Most modern trading platforms like TradingView, Binance, or MetaTrader support Heikin Ashi charts. Here’s how to set it up specifically for Dogecoin:
- Log into your preferred platform and navigate to the Dogecoin chart section
- Select the timeframe you want to analyze (e.g., 1-hour, 4-hour, daily)
- Look for the indicator or chart settings menu
- Search for “Heikin Ashi” and apply it to the chart
- You should now see smoothed-out candles replacing the traditional ones
Some platforms may require installing a custom script if Heikin Ashi isn’t available by default. Ensure that the DOGE/USDT pair is selected for accurate readings. Once set up, traders can begin analyzing patterns like doji formations, long wicks, or consecutive colored candles to determine trade setups.
Identifying Entry and Exit Points with Heikin Ashi Candles
One of the key advantages of using Heikin Ashi candles for Dogecoin is their ability to highlight trend continuation and reversal signals. Here are some common patterns to watch for:
- A green candle with no lower shadow suggests strong buying pressure and a healthy uptrend
- A red candle with no upper shadow indicates dominant selling activity
- A doji-shaped candle amid a trend might signal weakening momentum and a potential reversal
- Multiple small bodies with long wicks can indicate indecision in the market
Traders often wait for confirmation from subsequent candles before entering a position. For example, after a series of red Heikin Ashi candles, a green candle forming could be a sign of a short-term bottom. It’s crucial to combine these signals with volume analysis or other tools like RSI or MACD to filter out false breakouts.
Risk Management When Using Heikin Ashi Charts for DOGE
While Heikin Ashi improves clarity in trending markets, it introduces a degree of lag because it uses averaged data. Therefore, risk management becomes even more critical when trading Dogecoin using this method.
Here are essential steps to follow:
- Always place stop-loss orders based on recent swing highs or lows visible on the Heikin Ashi chart
- Adjust position size according to volatility; higher volatility requires smaller positions
- Avoid overtrading based solely on candle color without confirming with other technical tools
- Set realistic take-profit levels aligned with historical resistance or support zones
Because Dogecoin is influenced heavily by external events like celebrity tweets or community-driven hype, unexpected price jumps can occur even during seemingly stable trends. Hence, maintaining strict risk controls ensures that losses remain manageable even when the market behaves irrationally.
Frequently Asked Questions
Can I use Heikin Ashi charts for scalping Dogecoin?
Yes, but with caution. The lag in Heikin Ashi candles can make fast entries less reliable. If you're scalping DOGE, consider combining Heikin Ashi with faster indicators like Stochastic or Volume Profile for better timing.
Is Heikin Ashi suitable for all timeframes when trading DOGE?
Heikin Ashi works well across multiple timeframes. However, higher timeframes like 4-hour or daily offer more reliable signals due to reduced noise compared to 5-minute or 15-minute charts where false signals are more frequent.
How does Heikin Ashi differ from Renko charts for DOGE trading?
Heikin Ashi uses averaged candle values, while Renko charts plot bricks based only on price movement, ignoring time. Renko filters out minor fluctuations better, but Heikin Ashi retains more information about open/close dynamics, making it more versatile for certain strategies.
Can I build an automated trading system around Heikin Ashi for Dogecoin?
Yes, many algorithmic traders incorporate Heikin Ashi logic into their bots. However, backtesting is essential to account for the lag factor and ensure profitability in live conditions. Make sure to include filters like volume or volatility thresholds to avoid whipsaws.
Disclaimer:info@kdj.com
The information provided is not trading advice. kdj.com does not assume any responsibility for any investments made based on the information provided in this article. Cryptocurrencies are highly volatile and it is highly recommended that you invest with caution after thorough research!
If you believe that the content used on this website infringes your copyright, please contact us immediately (info@kdj.com) and we will delete it promptly.
- BlockDAG Leads the Web3 Race with Sports Partnerships and Strategic Pricing
- 2025-07-08 10:50:12
- Pepe, Dogecoin, Shiba Inu: Meme Coin Mania or Calculated Crypto?
- 2025-07-08 10:30:12
- Bitcoin, Ethereum, and Tariff Tussles: Decoding the Crypto Market's Latest Moves
- 2025-07-08 10:30:12
- PEPE, AVAX, Technical Analysis: Riding the Crypto Wave
- 2025-07-08 11:10:12
- BTC Whale's $8.6B Move: Hack, Transfer, or Just a FUD Panic?
- 2025-07-08 11:10:12
- Bitcoin, Treasuries, and the Surge: What's Driving the Market?
- 2025-07-08 11:15:11
Related knowledge

How to trade Dogecoin based on funding rates and open interest
Jul 07,2025 at 02:49am
Understanding Funding Rates in Dogecoin TradingFunding rates are periodic payments made to either long or short traders depending on the prevailing market conditions. In perpetual futures contracts, these rates help align the price of the contract with the spot price of Dogecoin (DOGE). When funding rates are positive, it indicates that long positions p...

What is the 'God Mode' indicator for Bitcoincoin
Jul 07,2025 at 04:42pm
Understanding the 'God Mode' IndicatorThe 'God Mode' indicator is a term that has emerged within cryptocurrency trading communities, particularly those focused on meme coins like Dogecoin (DOGE). While not an officially recognized technical analysis tool or formula, it refers to a set of conditions or patterns in price action and volume that some trader...

Using Gann Fans on the Dogecoin price chart
Jul 07,2025 at 09:43pm
Understanding Gann Fans and Their Relevance in Cryptocurrency TradingGann Fans are a technical analysis tool developed by W.D. Gann, a renowned trader from the early 20th century. These fans consist of diagonal lines that radiate out from a central pivot point on a price chart, typically drawn at specific angles such as 1x1 (45 degrees), 2x1, 1x2, and o...

How to spot manipulation on the Dogecoin chart
Jul 06,2025 at 12:35pm
Understanding the Basics of Chart ManipulationChart manipulation in the cryptocurrency space, particularly with Dogecoin, refers to artificial price movements caused by coordinated trading activities rather than genuine market demand. These manipulations are often executed by large holders (commonly known as whales) or organized groups aiming to mislead...

Bitcoincoin market structure break explained
Jul 07,2025 at 02:51am
Understanding the Dogecoin Market StructureDogecoin, initially created as a meme-based cryptocurrency, has evolved into a significant player in the crypto market. Its market structure refers to how price action is organized over time, including support and resistance levels, trend lines, and patterns that help traders anticipate future movements. A mark...

How to backtest a Dogecoin moving average strategy
Jul 08,2025 at 04:50am
What is a Moving Average Strategy in Cryptocurrency Trading?A moving average strategy is one of the most commonly used technical analysis tools in cryptocurrency trading. It involves analyzing the average price of an asset, such as Dogecoin (DOGE), over a specified time period to identify trends and potential entry or exit points. Traders often use diff...

How to trade Dogecoin based on funding rates and open interest
Jul 07,2025 at 02:49am
Understanding Funding Rates in Dogecoin TradingFunding rates are periodic payments made to either long or short traders depending on the prevailing market conditions. In perpetual futures contracts, these rates help align the price of the contract with the spot price of Dogecoin (DOGE). When funding rates are positive, it indicates that long positions p...

What is the 'God Mode' indicator for Bitcoincoin
Jul 07,2025 at 04:42pm
Understanding the 'God Mode' IndicatorThe 'God Mode' indicator is a term that has emerged within cryptocurrency trading communities, particularly those focused on meme coins like Dogecoin (DOGE). While not an officially recognized technical analysis tool or formula, it refers to a set of conditions or patterns in price action and volume that some trader...

Using Gann Fans on the Dogecoin price chart
Jul 07,2025 at 09:43pm
Understanding Gann Fans and Their Relevance in Cryptocurrency TradingGann Fans are a technical analysis tool developed by W.D. Gann, a renowned trader from the early 20th century. These fans consist of diagonal lines that radiate out from a central pivot point on a price chart, typically drawn at specific angles such as 1x1 (45 degrees), 2x1, 1x2, and o...

How to spot manipulation on the Dogecoin chart
Jul 06,2025 at 12:35pm
Understanding the Basics of Chart ManipulationChart manipulation in the cryptocurrency space, particularly with Dogecoin, refers to artificial price movements caused by coordinated trading activities rather than genuine market demand. These manipulations are often executed by large holders (commonly known as whales) or organized groups aiming to mislead...

Bitcoincoin market structure break explained
Jul 07,2025 at 02:51am
Understanding the Dogecoin Market StructureDogecoin, initially created as a meme-based cryptocurrency, has evolved into a significant player in the crypto market. Its market structure refers to how price action is organized over time, including support and resistance levels, trend lines, and patterns that help traders anticipate future movements. A mark...

How to backtest a Dogecoin moving average strategy
Jul 08,2025 at 04:50am
What is a Moving Average Strategy in Cryptocurrency Trading?A moving average strategy is one of the most commonly used technical analysis tools in cryptocurrency trading. It involves analyzing the average price of an asset, such as Dogecoin (DOGE), over a specified time period to identify trends and potential entry or exit points. Traders often use diff...
See all articles


