


![Xu Zhenzhen💞Wu Tianhao|He helps his neighbor casually on a rainy night. Who would have thought that he would be the dubbing master I have been chasing for many years? The male god was disabled in a car accident and suffered from low self-esteem and isolation. He was forced to pretend to be a couple to deal with the pressure to get married. I directly cured him and he finally stood up! [Sound caught in] #sweetpet #OverbearingPresident #Short drama #drama](/uploads/2026/06/18/cryptocurrencies-news/videos/origin_6a32ce38ba7ca_image_500_375.webp "Xu Zhenzhen💞Wu Tianhao|He helps his neighbor casually on a rainy night. Who would have thought that he would be the dubbing master I have been chasing for many years? The male god was disabled in a car accident and suffered from low self-esteem and isolation. He was forced to pretend to be a couple to deal with the pressure to get married. I directly cured him and he finally stood up! [Sound caught in] #sweetpet #OverbearingPresident #Short drama #drama")


-
 bitcoin
 $87959.907984 USD
1.34% - ethereum
$2920.497338 USD
3.04% - tether
$0.999775 USD
0.00% - xrp
$2.237324 USD
8.12% - bnb
$860.243768 USD
0.90% - solana
$138.089498 USD
5.43% - usd-coin
$0.999807 USD
0.01% - tron
$0.272801 USD
-1.53% - dogecoin
$0.150904 USD
2.96% - cardano
$0.421635 USD
1.97% - hyperliquid
$32.152445 USD
2.23% - bitcoin-cash
$533.301069 USD
-1.94% - chainlink
$12.953417 USD
2.68% - unus-sed-leo
$9.535951 USD
0.73% - zcash
$521.483386 USD
-2.87%


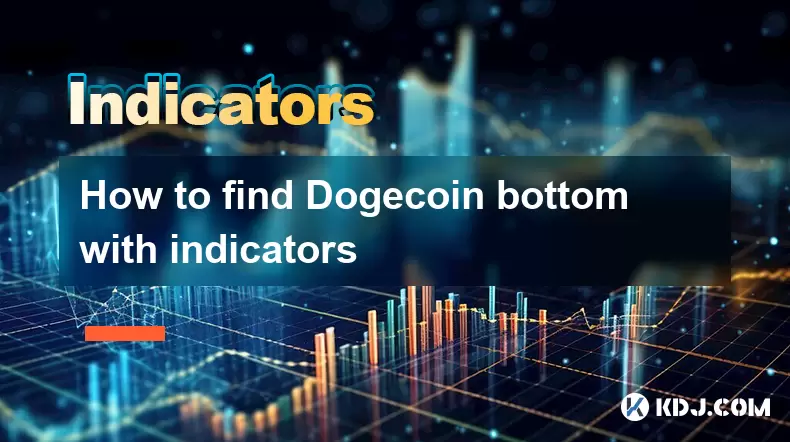
How to find Dogecoin bottom with indicators
"Traders use moving averages, RSI, MACD, and volume analysis to identify potential Dogecoin (DOGE) bottoms and anticipate trend reversals in the volatile crypto market."
Jul 07, 2025 at 02:50 am
Understanding the Basics of Identifying a Dogecoin Bottom
Identifying the bottom of Dogecoin (DOGE) using technical indicators requires a combination of analytical tools and market observation. A 'bottom' in this context refers to the point where the price has reached its lowest level before a potential reversal occurs. Traders often look for signs that selling pressure is decreasing and buying interest is increasing. This process involves analyzing volume, momentum, trend strength, and historical support levels.
The first step is understanding what constitutes a bottom in cryptocurrency trading. Unlike traditional markets, crypto assets like Dogecoin are known for high volatility and rapid price swings. Therefore, relying on a single indicator may not provide accurate signals. Combining multiple tools such as moving averages, RSI, MACD, and volume analysis increases the probability of identifying a potential reversal zone.
Using Moving Averages to Detect Potential Reversals
Moving averages smooth out price data to form a trend-following indicator. They help traders identify whether an asset is trending up or down and can signal potential reversals when certain crossovers occur.
- Use the 50-day and 200-day moving averages to determine long-term trends. When the 50-day crosses above the 200-day, it’s called a Golden Cross, suggesting a bullish phase. Conversely, a Death Cross (50-day crossing below 200-day) indicates bearish sentiment.
- Observe the 20-day exponential moving average (EMA) for short-term support levels. If Dogecoin’s price finds support at or near this EMA during a downtrend, it could indicate a potential bottom forming.
These averages act as dynamic support and resistance levels. When Dogecoin’s price touches or slightly breaches these levels and then bounces back, it might suggest that institutional or large retail buyers are stepping in.
Leveraging RSI for Overbought and Oversold Signals
The Relative Strength Index (RSI) is a momentum oscillator that measures the speed and change of price movements. It helps traders identify overbought or oversold conditions, which can signal possible reversals.
- Set RSI to a 14-period timeframe for standard readings. An RSI reading below 30 typically suggests oversold conditions, indicating that Dogecoin may be nearing a bottom.
- Watch for RSI divergence — if the price makes a new low but the RSI does not, this bullish divergence may hint at weakening selling pressure and a potential reversal.
However, it's important to note that in strong downtrends, RSI can remain in oversold territory for extended periods. Therefore, RSI should not be used in isolation but combined with other tools like volume or candlestick patterns.
Analyzing Volume Patterns Around Key Levels
Volume is a critical component in confirming price action. A significant increase in volume during a sharp decline followed by a decrease in volume during subsequent dips can signal capitulation and a possible bottom.
- Look for a spike in volume during a steep drop — this may represent panic selling, often a precursor to a bottom.
- Observe shrinking volume on retests of recent lows — if volume dries up after a big sell-off, it suggests sellers are exhausted, and buyers may soon take control.
Volume analysis works best when combined with support levels or Fibonacci retracement zones. For instance, if Dogecoin approaches a key support level and volume surges upward with a bullish candle, it could mark the start of a recovery phase.
Utilizing the MACD for Confirmation of Trend Changes
The Moving Average Convergence Divergence (MACD) is another momentum indicator that shows the relationship between two moving averages of a security’s price. It can confirm trend changes and signal entry opportunities.
- Monitor the MACD line crossing above the signal line — this is a bullish signal that may indicate a bottom is forming.
- Check for histogram contraction — as the histogram bars shrink, it suggests weakening momentum, potentially signaling the end of a downtrend.
It’s crucial to wait for confirmation from price action before acting on MACD signals. For example, if the MACD turns bullish but Dogecoin continues to make lower lows, the signal may be premature or false.
Frequently Asked Questions
What timeframes are best for analyzing Dogecoin bottoms with indicators?The ideal approach involves using multiple timeframes. Start with the daily chart to understand the broader trend and then switch to the 4-hour or 1-hour charts for precise entries. Weekly charts can also offer context for long-term support levels.
Can I rely solely on one indicator to find the Dogecoin bottom?No, relying on a single indicator increases the risk of false signals. The most effective strategy combines several indicators like RSI, MACD, moving averages, and volume to filter out noise and confirm potential reversals.
Is it possible for Dogecoin to have multiple bottoms within a downtrend?Yes, especially in volatile markets like cryptocurrency. Dogecoin may experience several mini-reversals before establishing a definitive bottom. These intermediate bottoms can act as temporary supports but may not indicate a full trend reversal.
How do news events affect Dogecoin's price behavior around potential bottoms?News events, particularly those related to Elon Musk, regulatory developments, or major exchange listings, can cause sudden spikes or drops in Dogecoin’s price. These events may create false bottoms or accelerate real reversals. Always consider fundamental factors alongside technical analysis.
Disclaimer:info@kdj.com
The information provided is not trading advice. kdj.com does not assume any responsibility for any investments made based on the information provided in this article. Cryptocurrencies are highly volatile and it is highly recommended that you invest with caution after thorough research!
If you believe that the content used on this website infringes your copyright, please contact us immediately (info@kdj.com) and we will delete it promptly.


- Bitcoin, eCash Fork, and Airdrop Dynamics: A Deep Dive into Crypto's Latest Controversies
- 2026-05-03 12:55:01
- Consensus 2026 Miami: Web3, Blockchain, Cryptocurrency, NFTs, Metaverse, Conference, May 5th — Where Wall Street Meets the Digital Frontier
- 2026-05-02 12:45:01
- Fed Holds Rates Steady, Triggering Bitcoin Price Drop Amidst Geopolitical Tensions
- 2026-05-01 06:45:01
- Bitcoin Miners Electrify the Grid: Ohio Gas Plant Acquisition Powers Up a New Era for Digital Gold
- 2026-05-01 00:45:01
- MegaETH's MEGA Token Hits the Big Apple: Setting New Performance Benchmarks for Real-Time Blockchain
- 2026-05-01 00:55:01
- Solana's Slippery Slope: Price Prediction Points to Resistance Loss and Potential Further Drops
- 2026-05-01 06:45:01
Related knowledge

What Are the Most Popular Crypto Indicators in 2026? Which Ones Still Work?
Jun 15,2026 at 04:40pm
RSI: The Enduring Momentum Gauge1. RSI remains one of the most widely adopted indicators across all timeframes, from scalping to position trading. 2. ...

What Is the Aroon Indicator? Can It Help Predict New Trends?
Jun 13,2026 at 01:37am
Market Volatility Patterns1. Bitcoin price swings often exceed 5% within a single trading session during high-liquidity events such as ETF inflow anno...

How to Confirm Trend Reversals Before Entering a Trade?
Jun 12,2026 at 02:39pm
Market Volatility Patterns1. Bitcoin’s price movements often reflect macroeconomic signals such as Federal Reserve interest rate decisions and inflati...

What Is a Volume Spike? Does It Signal a Major Price Move?
Jun 14,2026 at 03:20pm
Understanding Volume Spikes in Cryptocurrency Markets1. A volume spike refers to a sudden and substantial increase in the number of tokens traded with...

How to Use K-Line Indicators During High Volatility Events?
Jun 13,2026 at 11:21pm
K-Line Structure Recognition in Extreme Market Conditions1. A single K-line during high volatility often exhibits abnormally long wicks, indicating ra...

What Is the Best Indicator Combination for Bitcoin Trading?
Jun 13,2026 at 08:20am
BTC.D and Market Phase Recognition1. BTC.D reflects the proportional weight of Bitcoin’s market capitalization against the aggregate crypto market cap...
What Are the Most Popular Crypto Indicators in 2026? Which Ones Still Work?
Jun 15,2026 at 04:40pm
RSI: The Enduring Momentum Gauge1. RSI remains one of the most widely adopted indicators across all timeframes, from scalping to position trading. 2. ...
What Is the Aroon Indicator? Can It Help Predict New Trends?
Jun 13,2026 at 01:37am
Market Volatility Patterns1. Bitcoin price swings often exceed 5% within a single trading session during high-liquidity events such as ETF inflow anno...
How to Confirm Trend Reversals Before Entering a Trade?
Jun 12,2026 at 02:39pm
Market Volatility Patterns1. Bitcoin’s price movements often reflect macroeconomic signals such as Federal Reserve interest rate decisions and inflati...
What Is a Volume Spike? Does It Signal a Major Price Move?
Jun 14,2026 at 03:20pm
Understanding Volume Spikes in Cryptocurrency Markets1. A volume spike refers to a sudden and substantial increase in the number of tokens traded with...
How to Use K-Line Indicators During High Volatility Events?
Jun 13,2026 at 11:21pm
K-Line Structure Recognition in Extreme Market Conditions1. A single K-line during high volatility often exhibits abnormally long wicks, indicating ra...
What Is the Best Indicator Combination for Bitcoin Trading?
Jun 13,2026 at 08:20am
BTC.D and Market Phase Recognition1. BTC.D reflects the proportional weight of Bitcoin’s market capitalization against the aggregate crypto market cap...
See all articles


