-
 Bitcoin
 $117500
1.38% -
 Ethereum
 $3753
3.41% -
 XRP
XRP $3.156
1.94% -
 Tether USDt
 $1.000
-0.01% -
 BNB
BNB $782.5
2.66% -
 Solana
 $186.3
4.36% -
 USDC
USDC $1.000
-0.02% -
 Dogecoin
 $0.2379
4.64% -
 TRON
TRON $0.3177
1.24% -
 Cardano
 $0.8267
2.65% -
 Hyperliquid
 $44.40
5.58% -
 Stellar
 $0.4455
6.46% -
 Sui
Sui $4.004
9.56% -
 Chainlink
 $18.41
4.95% -
 Hedera
 $0.2681
12.63% -
 Bitcoin Cash
 $555.0
5.47% -
 Avalanche
 $24.13
3.94% -
 Litecoin
 $113.6
3.07% -
 Shiba Inu
 $0.00001410
5.62% -
 UNUS SED LEO
 $8.978
0.00% -
 Toncoin
 $3.329
7.72% -
 Ethena USDe
 $1.001
-0.01% -
 Uniswap
 $10.53
6.18% -
 Polkadot
 $4.115
4.44% -
 Monero
 $323.8
-3.70% -
 Dai
Dai $1.000
0.01% -
 Bitget Token
 $4.580
2.83% -
 Pepe
Pepe $0.00001258
4.49% -
 Aave
Aave $297.9
3.98% -
 Cronos
 $0.1338
6.28%
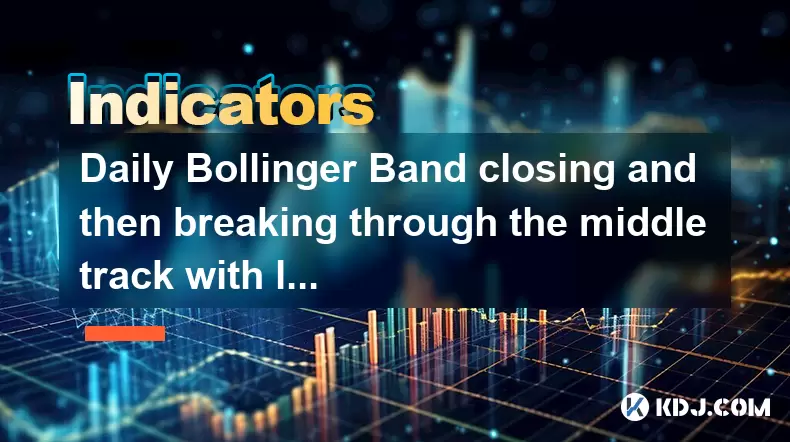
Daily Bollinger Band closing and then breaking through the middle track with large volume and short-term opportunity
A daily close back inside Bollinger Bands near the middle band, followed by a high-volume breakout, signals a potential reversal—offering a high-probability swing trade in crypto markets.
Jul 25, 2025 at 02:56 pm
Understanding the Bollinger Bands Structure
Bollinger Bands are a widely used technical analysis tool in the cryptocurrency trading space, developed by John Bollinger. They consist of three lines: the middle band, typically a 20-period simple moving average (SMA); the upper band, which is two standard deviations above the middle band; and the lower band, two standard deviations below. These bands dynamically adjust to market volatility, expanding during high volatility and contracting during low volatility.
When analyzing daily Bollinger Band movements, traders focus on how price interacts with these bands. A closing near or beyond the middle track after being outside the bands suggests a potential shift in momentum. The middle band acts as both support and resistance depending on the trend direction. When price closes back inside the bands and then breaks through the middle track with conviction, it often signals a reversal or continuation, especially if confirmed by volume.
Significance of Closing Back Inside the Bands
A daily close that moves back inside the Bollinger Bands after trading outside (either above the upper or below the lower band) indicates a reversion to the mean. This is particularly meaningful when the close occurs near the middle track. In cryptocurrency markets, which are prone to sharp swings, such a close may suggest that extreme sentiment—either excessive fear or greed—is cooling.
For example, if Bitcoin has been trading above the upper band due to a sudden pump, a daily close back inside the bands, especially near the 20-day SMA, implies that the bullish momentum may be waning. Conversely, if the price was below the lower band and closes back inside near the middle, it could indicate that selling pressure is easing. This type of close sets the stage for a potential breakout or breakdown through the middle band, depending on the next day’s action.
Breaking Through the Middle Track with High Volume
A breakthrough of the middle track following a re-entry into the bands is a critical signal. However, its reliability increases significantly when accompanied by large trading volume. Volume confirms the strength of the move. In crypto, where markets can be manipulated or driven by short-term noise, high volume serves as validation that institutional or algorithmic participation is likely involved.
To identify this setup:
- Monitor the daily candlestick closing inside the bands after an outer-band touch.
- Observe the next day’s price action: does it cross above or below the middle band?
- Check the volume: is it substantially higher than the 20-day average volume?
- Confirm the break: does the candle close beyond the middle band with strong momentum?
For instance, if Ethereum closes back inside the bands near the middle after a drop, and the following day breaks above the middle SMA on double the average volume, this could signal a short-term bullish reversal. Traders might interpret this as a buy signal for a swing trade.
Short-Term Trading Opportunity Setup
This pattern—close inside, break middle band, high volume—can be exploited for short-term gains. The key is precise entry and risk management. Here’s how to set up the trade:
- Wait for the first daily close back inside the bands after touching or exceeding an outer band.
- On the next day, monitor price action relative to the middle band.
- Enter a long position if price breaks above the middle band with volume 1.5x or higher than the 20-day average.
- Place a stop-loss just below the recent swing low or below the middle band if the breakout occurs from below.
- For short positions, reverse the logic: enter when price breaks below the middle band after a high close, with elevated volume.
Use crypto trading platforms like Binance, Bybit, or Kraken to set conditional orders. For example, use a buy-stop order just above the middle band to automate entry. Always verify volume via the platform’s volume profile or on-chain data tools like Glassnode or CryptoQuant.
Filtering False Signals in Volatile Markets
Cryptocurrency markets are highly volatile, and Bollinger Band signals can generate false breakouts. To reduce risk:
- Avoid trading during major news events like Fed announcements or Bitcoin halvings, where price may move unpredictably.
- Confirm the trend using RSI (Relative Strength Index): if RSI is above 70, a bullish break may be overextended; below 30, a bearish break may be oversold.
- Use on-chain metrics: increasing exchange outflows during a breakout may confirm accumulation.
- Cross-verify with moving average convergence—if the 50-day MA is above the 200-day MA, favor long setups.
Also, consider the timeframe alignment. If the 4-hour chart shows a similar pattern reinforcing the daily signal, the probability of success increases. Avoid acting on isolated daily signals without higher-timeframe confirmation.
Practical Example Using Binance Data
Suppose Solana (SOL) trades at $140, touching the lower Bollinger Band on Day 1 due to a market-wide dip. On Day 2, it closes at $148, back inside the bands and near the middle SMA of $147. On Day 3, SOL opens at $149, climbs to $152, and closes at $151, breaking above the middle band, with volume spiking to 2.3x average.
Steps taken:
- Confirm the Bollinger Bands are set to 20,2 on the daily chart.
- Check volume: use Binance’s volume indicator to compare with the 20-day average.
- Set a buy limit order at $147.50 to enter near the breakout point.
- Place a stop-loss at $144.50, below the recent swing low.
- Target partial profit at $158 (upper band resistance) and trail the rest.
This setup leverages the mean reversion followed by momentum confirmation, a classic short-term opportunity in crypto.
Frequently Asked Questions
What time frame should I use to confirm the volume spike?
Use the 20-day simple moving average of volume as the baseline. A spike is significant when current volume exceeds 1.5 times this average. Most crypto platforms display this directly on the volume histogram.
Can this strategy work on altcoins with low liquidity?
It can, but with caution. Low-liquidity altcoins are prone to whale manipulation and false breakouts. Only apply this strategy to coins with daily volume over $50 million and consistent exchange presence.
How do I adjust Bollinger Bands settings for different cryptos?
Stick to the default 20,2 setting for daily charts. While some traders tweak deviations, the standard setting provides consistency across assets. Adjusting may reduce signal reliability.
Should I use leverage on this short-term play?
Leverage increases risk. Given the volatility, use no more than 3x leverage if trading futures. For spot trading, avoid leverage entirely and manage position size through capital allocation.
Disclaimer:info@kdj.com
The information provided is not trading advice. kdj.com does not assume any responsibility for any investments made based on the information provided in this article. Cryptocurrencies are highly volatile and it is highly recommended that you invest with caution after thorough research!
If you believe that the content used on this website infringes your copyright, please contact us immediately (info@kdj.com) and we will delete it promptly.
- UAE's Digital Asset Revolution: Stablecoin Regulations Take Center Stage
- 2025-07-26 10:40:11
- VIRTUAL Weekly Drop: Recovery Analysis and Privacy Push
- 2025-07-26 08:50:11
- Bitcoin, Cynthia Lummis, and Freedom Money: A New Yorker's Take
- 2025-07-26 08:30:11
- Pudgy Penguins, Crypto Prices, and the Altseason Buzz: What's the Hype?
- 2025-07-26 10:51:48
- Crypto Gainers, Top 10, Week 30: Altcoins Buck the Trend
- 2025-07-26 08:55:12
- Solana, Altcoins, and Coinbase: What's the Buzz?
- 2025-07-26 06:30:12
Related knowledge

What does it mean that the rebound is blocked after the moving average is arranged in a short position for the first time?
Jul 26,2025 at 10:51am
Understanding the Short-Term Moving Average ConfigurationWhen traders refer to a 'short position arrangement' in moving averages, they are describing ...

What does it mean when the price rises along the 5-day moving average for five consecutive days?
Jul 26,2025 at 08:07am
Understanding the 5-Day Moving Average in Cryptocurrency TradingThe 5-day moving average (5DMA) is a widely used technical indicator in cryptocurrency...

What does it mean when the price breaks through the 60-day moving average with a large volume but shrinks the next day?
Jul 26,2025 at 06:01am
Understanding the 60-Day Moving Average in Cryptocurrency TradingThe 60-day moving average (60DMA) is a widely used technical indicator in the cryptoc...
What does it mean when OBV continues to hit new highs but the price is stagnant?
Jul 26,2025 at 09:57am
Understanding the On-Balance Volume (OBV) IndicatorThe On-Balance Volume (OBV) is a technical analysis indicator that uses volume flow to predict chan...
What does the golden cross of EMA12 and EMA26 but the low trading volume reflect?
Jul 26,2025 at 06:44am
Understanding the Golden Cross in EMA12 and EMA26The golden cross is a widely recognized technical indicator in the cryptocurrency market, signaling a...
What does it mean when the price breaks through the 30-day moving average and is accompanied by a large volume?
Jul 26,2025 at 03:35am
Understanding the 30-Day Moving Average in Cryptocurrency TradingThe 30-day moving average (MA) is a widely used technical indicator in the cryptocurr...

What does it mean that the rebound is blocked after the moving average is arranged in a short position for the first time?
Jul 26,2025 at 10:51am
Understanding the Short-Term Moving Average ConfigurationWhen traders refer to a 'short position arrangement' in moving averages, they are describing ...

What does it mean when the price rises along the 5-day moving average for five consecutive days?
Jul 26,2025 at 08:07am
Understanding the 5-Day Moving Average in Cryptocurrency TradingThe 5-day moving average (5DMA) is a widely used technical indicator in cryptocurrency...

What does it mean when the price breaks through the 60-day moving average with a large volume but shrinks the next day?
Jul 26,2025 at 06:01am
Understanding the 60-Day Moving Average in Cryptocurrency TradingThe 60-day moving average (60DMA) is a widely used technical indicator in the cryptoc...

What does it mean when OBV continues to hit new highs but the price is stagnant?
Jul 26,2025 at 09:57am
Understanding the On-Balance Volume (OBV) IndicatorThe On-Balance Volume (OBV) is a technical analysis indicator that uses volume flow to predict chan...

What does the golden cross of EMA12 and EMA26 but the low trading volume reflect?
Jul 26,2025 at 06:44am
Understanding the Golden Cross in EMA12 and EMA26The golden cross is a widely recognized technical indicator in the cryptocurrency market, signaling a...

What does it mean when the price breaks through the 30-day moving average and is accompanied by a large volume?
Jul 26,2025 at 03:35am
Understanding the 30-Day Moving Average in Cryptocurrency TradingThe 30-day moving average (MA) is a widely used technical indicator in the cryptocurr...
See all articles


