


![💖Woke up to be the daughter of a wealthy family, or was he a short-lived person who was tricked by his scumbag stepmother? ! He took revenge ruthlessly with the spatial spiritual spring in his hand. After breaking off the engagement, he remarried his fiancé, his seriously ill brother-in-law. He cured him and brought a lot of military wives to make a lot of money! [The delicate daughter goes to the countryside to find a husband: I opened the spiritual spring and took her to the family home -] # across # short play](/uploads/2026/06/23/cryptocurrencies-news/videos/origin_6a3965b62c558_image_500_375.webp "💖Woke up to be the daughter of a wealthy family, or was he a short-lived person who was tricked by his scumbag stepmother? ! He took revenge ruthlessly with the spatial spiritual spring in his hand. After breaking off the engagement, he remarried his fiancé, his seriously ill brother-in-law. He cured him and brought a lot of military wives to make a lot of money! [The delicate daughter goes to the countryside to find a husband: I opened the spiritual spring and took her to the family home -] # across # short play")


-
 bitcoin
 $87959.907984 USD
1.34% - ethereum
$2920.497338 USD
3.04% - tether
$0.999775 USD
0.00% - xrp
$2.237324 USD
8.12% - bnb
$860.243768 USD
0.90% - solana
$138.089498 USD
5.43% - usd-coin
$0.999807 USD
0.01% - tron
$0.272801 USD
-1.53% - dogecoin
$0.150904 USD
2.96% - cardano
$0.421635 USD
1.97% - hyperliquid
$32.152445 USD
2.23% - bitcoin-cash
$533.301069 USD
-1.94% - chainlink
$12.953417 USD
2.68% - unus-sed-leo
$9.535951 USD
0.73% - zcash
$521.483386 USD
-2.87%


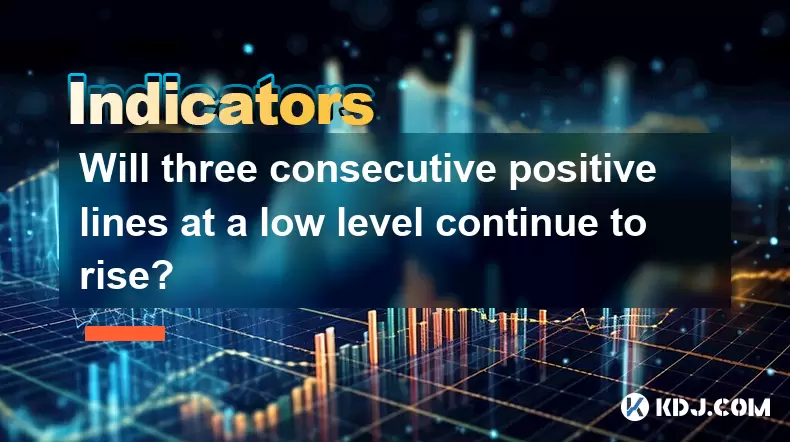
Will three consecutive positive lines at a low level continue to rise?
Three consecutive positive lines at a low level may signal a reversal, but their reliability depends on market trends, volume, and other indicators.
Jun 09, 2025 at 12:01 am
Introduction to Candlestick Patterns in Cryptocurrency Trading
In the world of cryptocurrency trading, understanding candlestick patterns is crucial for making informed decisions. One such pattern that traders often look for is three consecutive positive lines at a low level. This pattern can signal a potential reversal from a downtrend to an uptrend. However, the question remains: Will three consecutive positive lines at a low level continue to rise? Let's delve into the details of this pattern and explore its implications in the cryptocurrency market.
Understanding Three Consecutive Positive Lines
The pattern of three consecutive positive lines refers to three consecutive bullish (green) candlesticks appearing on a chart. When these candlesticks appear at a low level, it suggests that the price may be reaching the bottom of a downtrend and could be poised for a reversal. A low level is typically defined as a price point that is significantly below recent highs and often close to a support level.
Analyzing the Pattern's Reliability
While three consecutive positive lines at a low level can be a bullish signal, its reliability varies. Several factors need to be considered to determine whether the pattern will lead to a continued rise in price. These factors include the overall market trend, trading volume, and the presence of other technical indicators.
- Market Trend: If the broader market trend is bearish, the pattern might not lead to a sustained rise. Conversely, in a bullish market, the pattern's significance increases.
- Trading Volume: High trading volume during the formation of the three positive lines can indicate strong buying pressure, increasing the likelihood of a continued rise.
- Other Technical Indicators: The presence of other bullish indicators, such as moving averages or RSI (Relative Strength Index), can reinforce the pattern's bullish signal.
Case Studies of Three Consecutive Positive Lines
Examining historical data can provide insights into the effectiveness of three consecutive positive lines at a low level. Let's look at a few case studies from the cryptocurrency market.
- Bitcoin (BTC) in 2020: In March 2020, Bitcoin experienced a significant drop due to global economic uncertainty. After reaching a low of around $3,800, three consecutive positive lines appeared. This pattern was followed by a gradual rise, with Bitcoin reaching $10,000 by the end of June 2020.
- Ethereum (ETH) in 2018: In the aftermath of the 2017 bull run, Ethereum saw a prolonged bear market. In December 2018, ETH hit a low of around $80, and three consecutive positive lines emerged. However, this pattern did not lead to a sustained rise, as ETH continued to trade sideways for several months.
These case studies illustrate that while three consecutive positive lines at a low level can signal a potential reversal, the outcome is not guaranteed and depends on various market conditions.
Trading Strategies Based on the Pattern
Traders can use the pattern of three consecutive positive lines at a low level to develop trading strategies. Here are some approaches:
- Entry Point: Consider entering a long position after the third positive line, especially if it closes above the high of the second line. This can be a signal that the bullish momentum is strong.
- Stop-Loss: Set a stop-loss order below the low of the three positive lines to limit potential losses if the price reverses.
- Profit Target: Establish a profit target based on resistance levels or previous highs. Adjust the target as the price moves in your favor.
Risk Management and the Pattern
Effective risk management is essential when trading based on three consecutive positive lines at a low level. Here are some risk management strategies:
- Position Sizing: Determine the size of your position based on your overall risk tolerance and the potential reward of the trade.
- Diversification: Avoid putting all your capital into one trade. Diversify your investments across different cryptocurrencies to spread risk.
- Continuous Monitoring: Keep an eye on the market and be ready to adjust your strategy if conditions change. This includes moving stop-loss orders to lock in profits as the price rises.
Psychological Aspects of Trading the Pattern
The psychological aspect of trading cannot be overlooked when dealing with three consecutive positive lines at a low level. Traders often face emotional challenges such as fear of missing out (FOMO) or the fear of losing money. Here are some tips to manage these emotions:
- Stay Disciplined: Stick to your trading plan and avoid making impulsive decisions based on short-term price movements.
- Manage Expectations: Understand that not every trade will be successful. Focus on long-term consistency rather than short-term gains.
- Emotional Detachment: Try to remain emotionally detached from your trades. This can help you make more rational decisions.
Frequently Asked Questions
Q: Can three consecutive positive lines at a low level be a false signal?A: Yes, three consecutive positive lines at a low level can be a false signal. The pattern's reliability depends on various factors such as the overall market trend, trading volume, and the presence of other technical indicators. Always consider these factors before making a trading decision.
Q: How can I confirm the validity of three consecutive positive lines at a low level?A: To confirm the validity of three consecutive positive lines at a low level, look for corroborating evidence from other technical indicators. For instance, if the RSI is also showing bullish divergence or if the price is breaking above a key moving average, these can reinforce the pattern's bullish signal.
Q: Is it better to trade this pattern on shorter or longer timeframes?A: The effectiveness of three consecutive positive lines at a low level can vary depending on the timeframe. On shorter timeframes, the pattern may lead to quicker but smaller moves, while on longer timeframes, it might signal more significant and sustained trends. Consider your trading style and risk tolerance when choosing a timeframe.
Q: Should I use this pattern in isolation or with other trading strategies?A: It's generally advisable to use three consecutive positive lines at a low level in conjunction with other trading strategies. Combining this pattern with other technical analysis tools and fundamental analysis can provide a more comprehensive view of the market and increase the probability of successful trades.
Disclaimer:info@kdj.com
The information provided is not trading advice. kdj.com does not assume any responsibility for any investments made based on the information provided in this article. Cryptocurrencies are highly volatile and it is highly recommended that you invest with caution after thorough research!
If you believe that the content used on this website infringes your copyright, please contact us immediately (info@kdj.com) and we will delete it promptly.


- Bitcoin, eCash Fork, and Airdrop Dynamics: A Deep Dive into Crypto's Latest Controversies
- 2026-05-03 12:55:01
- Consensus 2026 Miami: Web3, Blockchain, Cryptocurrency, NFTs, Metaverse, Conference, May 5th — Where Wall Street Meets the Digital Frontier
- 2026-05-02 12:45:01
- Fed Holds Rates Steady, Triggering Bitcoin Price Drop Amidst Geopolitical Tensions
- 2026-05-01 06:45:01
- Bitcoin Miners Electrify the Grid: Ohio Gas Plant Acquisition Powers Up a New Era for Digital Gold
- 2026-05-01 00:45:01
- MegaETH's MEGA Token Hits the Big Apple: Setting New Performance Benchmarks for Real-Time Blockchain
- 2026-05-01 00:55:01
- Solana's Slippery Slope: Price Prediction Points to Resistance Loss and Potential Further Drops
- 2026-05-01 06:45:01
Related knowledge

What Are the Most Popular Crypto Indicators in 2026? Which Ones Still Work?
Jun 15,2026 at 04:40pm
RSI: The Enduring Momentum Gauge1. RSI remains one of the most widely adopted indicators across all timeframes, from scalping to position trading. 2. ...

How to Build a Crypto Trading Strategy Around Technical Indicators?
Jun 21,2026 at 05:59am
Indicator Selection and Market Context1. RSI values below 30 signal oversold conditions across BTC/USDT 1-hour charts, yet historical backtests show f...

What Is the Aroon Indicator? Can It Help Predict New Trends?
Jun 13,2026 at 01:37am
Market Volatility Patterns1. Bitcoin price swings often exceed 5% within a single trading session during high-liquidity events such as ETF inflow anno...

How to Use Fibonacci Extensions for Crypto Profit Targets?
Jun 18,2026 at 03:59pm
Market Volatility Patterns1. Bitcoin’s price movements often exhibit sharp intraday swings exceeding 5% during major macroeconomic announcements. 2. E...

How to Confirm Trend Reversals Before Entering a Trade?
Jun 12,2026 at 02:39pm
Market Volatility Patterns1. Bitcoin’s price movements often reflect macroeconomic signals such as Federal Reserve interest rate decisions and inflati...

What Is a Volume Spike? Does It Signal a Major Price Move?
Jun 14,2026 at 03:20pm
Understanding Volume Spikes in Cryptocurrency Markets1. A volume spike refers to a sudden and substantial increase in the number of tokens traded with...
What Are the Most Popular Crypto Indicators in 2026? Which Ones Still Work?
Jun 15,2026 at 04:40pm
RSI: The Enduring Momentum Gauge1. RSI remains one of the most widely adopted indicators across all timeframes, from scalping to position trading. 2. ...
How to Build a Crypto Trading Strategy Around Technical Indicators?
Jun 21,2026 at 05:59am
Indicator Selection and Market Context1. RSI values below 30 signal oversold conditions across BTC/USDT 1-hour charts, yet historical backtests show f...
What Is the Aroon Indicator? Can It Help Predict New Trends?
Jun 13,2026 at 01:37am
Market Volatility Patterns1. Bitcoin price swings often exceed 5% within a single trading session during high-liquidity events such as ETF inflow anno...
How to Use Fibonacci Extensions for Crypto Profit Targets?
Jun 18,2026 at 03:59pm
Market Volatility Patterns1. Bitcoin’s price movements often exhibit sharp intraday swings exceeding 5% during major macroeconomic announcements. 2. E...
How to Confirm Trend Reversals Before Entering a Trade?
Jun 12,2026 at 02:39pm
Market Volatility Patterns1. Bitcoin’s price movements often reflect macroeconomic signals such as Federal Reserve interest rate decisions and inflati...
What Is a Volume Spike? Does It Signal a Major Price Move?
Jun 14,2026 at 03:20pm
Understanding Volume Spikes in Cryptocurrency Markets1. A volume spike refers to a sudden and substantial increase in the number of tokens traded with...
See all articles


