


")


-
 bitcoin
 $87959.907984 USD
1.34% - ethereum
$2920.497338 USD
3.04% - tether
$0.999775 USD
0.00% - xrp
$2.237324 USD
8.12% - bnb
$860.243768 USD
0.90% - solana
$138.089498 USD
5.43% - usd-coin
$0.999807 USD
0.01% - tron
$0.272801 USD
-1.53% - dogecoin
$0.150904 USD
2.96% - cardano
$0.421635 USD
1.97% - hyperliquid
$32.152445 USD
2.23% - bitcoin-cash
$533.301069 USD
-1.94% - chainlink
$12.953417 USD
2.68% - unus-sed-leo
$9.535951 USD
0.73% - zcash
$521.483386 USD
-2.87%


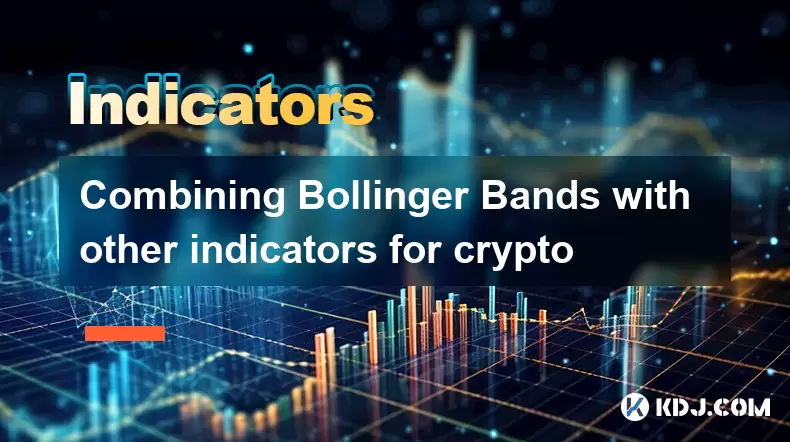
Combining Bollinger Bands with other indicators for crypto
Bollinger Bands, when combined with RSI, moving averages, volume, and MACD, offer a powerful strategy for identifying high-probability trade setups in volatile crypto markets.
Jul 14, 2025 at 06:00 pm
Understanding Bollinger Bands in the Context of Cryptocurrency
Bollinger Bands, developed by John Bollinger, are a popular technical analysis tool used to measure volatility and identify potential price levels in financial markets. In cryptocurrency trading, where volatility is often extreme, Bollinger Bands can help traders determine overbought or oversold conditions. The indicator consists of three lines: a simple moving average (SMA) in the middle, typically set at 20 periods, with two outer bands placed two standard deviations above and below the SMA.
Traders interpret Bollinger Bands in various ways. When prices touch or move outside the upper band, it may signal an overbought condition, while touching or breaking the lower band might indicate oversold territory. However, due to the high volatility of crypto assets, relying solely on Bollinger Bands can lead to false signals. This is why combining them with other indicators is crucial for more accurate decision-making.
Why Combining Bollinger Bands with RSI Enhances Signal Accuracy
The Relative Strength Index (RSI) is a momentum oscillator that measures the speed and change of price movements. It ranges from 0 to 100, with readings above 70 generally considered overbought, and those below 30 deemed oversold. Using RSI alongside Bollinger Bands helps confirm whether a price movement near the bands is sustainable or likely to reverse.
For example, if Bitcoin’s price touches the upper Bollinger Band and the RSI is above 70, this confluence suggests a strong likelihood of a pullback or consolidation. Conversely, if the price hits the lower band and the RSI drops below 30, it could indicate a potential reversal or bounce. Traders should wait for both indicators to align before entering a trade to avoid premature decisions.
Integrating Moving Averages for Trend Confirmation
Adding moving averages (MAs) such as the 50-period and 200-period exponential moving averages (EMAs) can provide clarity on the prevailing trend direction. In cryptocurrency markets, where trends can shift rapidly, identifying the dominant trend helps filter out noise and false breakouts.
A practical approach involves observing whether the price is consistently above or below key moving averages. If the price is above both EMAs and also hugging the upper Bollinger Band, it may suggest a strong uptrend. On the flip side, if the price remains below both EMAs and touches the lower Bollinger Band frequently, it might indicate a sustained downtrend.
Here’s how you can apply this strategy step-by-step:
- Apply the 20-period Bollinger Bands to your chart.
- Add the 50-EMA and 200-EMA to the same chart.
- Look for instances where the price interacts with the Bollinger Bands while respecting the EMA hierarchy.
- If the price breaks above the upper band but the 50-EMA is still below the 200-EMA, consider it a potential reversal zone rather than a continuation signal.
- Conversely, if the price dips below the lower band but the 50-EMA remains above the 200-EMA, treat it as a possible buying opportunity.
Leveraging Volume Indicators for Confirmation
Volume plays a critical role in confirming price actions. One widely used volume-based indicator is the On-Balance Volume (OBV). OBV adds volume on up days and subtracts it on down days, helping traders understand whether institutional or retail interest supports a move.
In crypto trading, when the price touches the upper Bollinger Band but OBV is declining, it suggests selling pressure is building despite rising prices — a sign of divergence. Similarly, if the price hits the lower band and OBV is increasing, it implies accumulation is happening even during a downtrend.
To incorporate OBV into your Bollinger Band strategy:
- Overlay OBV on your chart beneath the price action.
- Observe whether the OBV line is making new highs/lows in tandem with the price.
- If the price makes a new high near the upper band but OBV fails to do so, consider it a bearish divergence.
- When the price reaches the lower band and OBV starts rising, look for signs of a bullish reversal.
Using MACD for Momentum and Entry/Exit Signals
The Moving Average Convergence Divergence (MACD) is another powerful tool that complements Bollinger Bands by providing insights into momentum shifts and potential reversals. The MACD line crossing above the signal line indicates bullish momentum, while a cross below suggests bearish momentum.
Combining Bollinger Bands with MACD allows traders to time entries and exits more precisely. For instance, when Ethereum's price approaches the upper Bollinger Band and the MACD line crosses below the signal line, it reinforces a shorting opportunity. Conversely, when the price nears the lower band and the MACD line crosses above the signal line, it strengthens a long setup.
Implementing this combined strategy involves the following steps:
- Add the standard MACD settings (12, 26, 9) to your chart.
- Watch for crossovers around the time the price reaches either Bollinger Band.
- Avoid taking trades based solely on MACD or Bollinger Bands alone; instead, use them together to validate each other.
- In sideways markets, look for MACD divergences when the price touches the bands to spot potential reversals.
- Always check for histogram contraction or expansion to gauge momentum strength.
Frequently Asked Questions
Q: Can Bollinger Bands be adjusted for different cryptocurrencies?Yes, Bollinger Bands can be fine-tuned depending on the asset’s volatility. Some cryptocurrencies like Dogecoin or Shiba Inu tend to be more volatile, so increasing the standard deviation multiplier from 2 to 2.5 or using a shorter SMA period may yield better results.
Q: Is it necessary to use all the mentioned indicators together?No, it depends on your trading style and risk tolerance. Day traders might benefit from using multiple filters, whereas swing traders may prefer fewer indicators to avoid overcomplicating their strategy.
Q: How do I backtest a strategy combining Bollinger Bands with other indicators?You can use platforms like TradingView or MetaTrader to apply these indicators on historical charts. Mark entry and exit points manually or use built-in scripting tools to automate the process. Focus on consistency across multiple market cycles.
Q: Are there any risks associated with combining Bollinger Bands with other indicators?Yes, over-reliance on technical indicators can result in analysis paralysis or missing sudden news-driven moves common in crypto. Always consider fundamental factors and manage risk through stop-loss orders and position sizing.
Disclaimer:info@kdj.com
The information provided is not trading advice. kdj.com does not assume any responsibility for any investments made based on the information provided in this article. Cryptocurrencies are highly volatile and it is highly recommended that you invest with caution after thorough research!
If you believe that the content used on this website infringes your copyright, please contact us immediately (info@kdj.com) and we will delete it promptly.


- Bitcoin, eCash Fork, and Airdrop Dynamics: A Deep Dive into Crypto's Latest Controversies
- 2026-05-03 12:55:01
- Consensus 2026 Miami: Web3, Blockchain, Cryptocurrency, NFTs, Metaverse, Conference, May 5th — Where Wall Street Meets the Digital Frontier
- 2026-05-02 12:45:01
- Fed Holds Rates Steady, Triggering Bitcoin Price Drop Amidst Geopolitical Tensions
- 2026-05-01 06:45:01
- Bitcoin Miners Electrify the Grid: Ohio Gas Plant Acquisition Powers Up a New Era for Digital Gold
- 2026-05-01 00:45:01
- MegaETH's MEGA Token Hits the Big Apple: Setting New Performance Benchmarks for Real-Time Blockchain
- 2026-05-01 00:55:01
- Solana's Slippery Slope: Price Prediction Points to Resistance Loss and Potential Further Drops
- 2026-05-01 06:45:01
Related knowledge

What Is Crypto Top Indicator? Which Signals Show a Market Peak?
Jul 30,2026 at 06:59pm
Understanding Crypto Top Indicators1. Crypto top indicators are statistical tools designed to identify exhaustion points in upward price momentum befo...

What Is Crypto Bottom Indicator? How Do Traders Identify Market Lows?
Jul 21,2026 at 08:20am
Bitcoin Halving Mechanics1. Bitcoin’s protocol enforces a fixed issuance schedule where block rewards are cut in half approximately every 210,000 bloc...

What Is Early Warning Indicator for Crypto Price Drops?
Aug 02,2026 at 03:30am
Market Volatility Patterns1. Bitcoin price movements often exhibit sharp intraday swings exceeding 5% during major macroeconomic announcements. 2. Alt...

What Is Crypto Trend Reversal Indicator? Which Signals Should You Watch?
Jul 24,2026 at 11:00am
Market Volatility Patterns1. Bitcoin price swings often exceed 5% within a single 24-hour window during high-liquidity events such as ETF inflow annou...

What Is Weekly Bitcoin Chart Indicator? Can It Predict Long-Term Trends?
Jul 22,2026 at 07:39am
Market Volatility Patterns1. Price swings in cryptocurrency markets often exceed 10% within a 24-hour window, driven by liquidity constraints and algo...

What Is Daily K Line Indicator? How Do You Analyze Daily Trends?
Jul 29,2026 at 09:06pm
Market Volatility Patterns1. Bitcoin price swings often exceed 10% within a 24-hour window during high-liquidity events such as ETF approval announcem...
What Is Crypto Top Indicator? Which Signals Show a Market Peak?
Jul 30,2026 at 06:59pm
Understanding Crypto Top Indicators1. Crypto top indicators are statistical tools designed to identify exhaustion points in upward price momentum befo...
What Is Crypto Bottom Indicator? How Do Traders Identify Market Lows?
Jul 21,2026 at 08:20am
Bitcoin Halving Mechanics1. Bitcoin’s protocol enforces a fixed issuance schedule where block rewards are cut in half approximately every 210,000 bloc...
What Is Early Warning Indicator for Crypto Price Drops?
Aug 02,2026 at 03:30am
Market Volatility Patterns1. Bitcoin price movements often exhibit sharp intraday swings exceeding 5% during major macroeconomic announcements. 2. Alt...
What Is Crypto Trend Reversal Indicator? Which Signals Should You Watch?
Jul 24,2026 at 11:00am
Market Volatility Patterns1. Bitcoin price swings often exceed 5% within a single 24-hour window during high-liquidity events such as ETF inflow annou...
What Is Weekly Bitcoin Chart Indicator? Can It Predict Long-Term Trends?
Jul 22,2026 at 07:39am
Market Volatility Patterns1. Price swings in cryptocurrency markets often exceed 10% within a 24-hour window, driven by liquidity constraints and algo...
What Is Daily K Line Indicator? How Do You Analyze Daily Trends?
Jul 29,2026 at 09:06pm
Market Volatility Patterns1. Bitcoin price swings often exceed 10% within a 24-hour window during high-liquidity events such as ETF approval announcem...
See all articles


