-
 Bitcoin
 $108,010.6153
-0.99% -
 Ethereum
 $2,535.1451
-1.14% -
 Tether USDt
 $1.0002
-0.01% -
 XRP
XRP $2.2599
-0.33% -
 BNB
BNB $660.3442
-0.18% -
 Solana
 $149.0762
-1.43% -
 USDC
USDC $0.9999
0.00% -
 TRON
TRON $0.2866
-0.41% -
 Dogecoin
 $0.1669
-2.73% -
 Cardano
 $0.5765
-1.53% -
 Hyperliquid
 $38.5005
-2.98% -
 Bitcoin Cash
 $496.7709
-0.04% -
 Sui
Sui $2.8522
-2.12% -
 Chainlink
 $13.2812
-1.50% -
 UNUS SED LEO
 $9.0486
0.17% -
 Stellar
 $0.2466
-2.57% -
 Avalanche
 $17.8271
-2.84% -
 Shiba Inu
 $0.0...01158
-1.66% -
 Toncoin
 $2.7359
-4.01% -
 Hedera
 $0.1563
-1.78% -
 Litecoin
 $85.8096
-1.80% -
 Monero
 $313.7645
-2.86% -
 Dai
Dai $1.0002
0.02% -
 Polkadot
 $3.3494
-1.35% -
 Ethena USDe
 $1.0003
0.03% -
 Bitget Token
 $4.2980
-3.40% -
 Uniswap
 $7.3906
-0.28% -
 Aave
Aave $280.1449
-2.34% -
 Pepe
Pepe $0.0...09833
-2.41% -
 Pi
Pi $0.4546
-2.21%
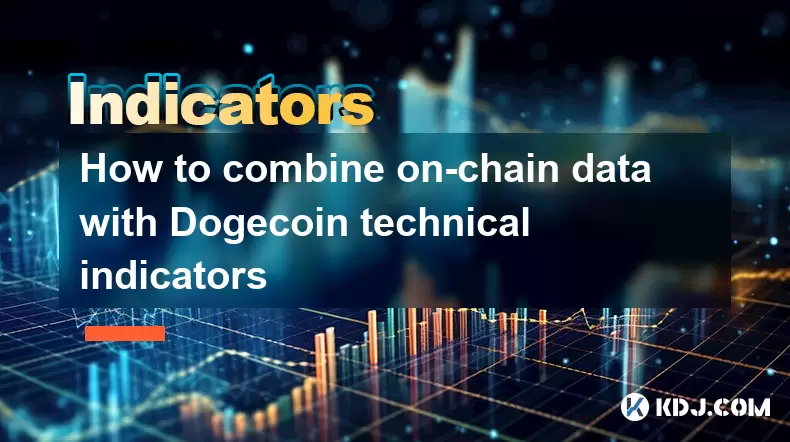
How to combine on-chain data with Dogecoin technical indicators
Analyzing Dogecoin's on-chain data alongside technical indicators like RSI and moving averages offers traders a comprehensive view of market trends, helping identify high-probability entry and exit points.
Jul 08, 2025 at 02:49 am

Understanding On-Chain Data and Dogecoin Technical Indicators
On-chain data refers to the information stored directly on a blockchain, such as transaction volume, wallet activity, network congestion, and token movement. Dogecoin technical indicators, on the other hand, are statistical tools used in trading to analyze price charts and predict future movements. Combining these two sources of information allows traders to gain a more holistic view of market sentiment and potential price action.
On-chain data provides insights into real-time user behavior and macro-level trends. For example, an increase in active wallets or large transactions could indicate growing interest in Dogecoin (DOGE). Meanwhile, technical indicators like Moving Averages (MA), Relative Strength Index (RSI), and Bollinger Bands help identify overbought or oversold conditions, trend reversals, and momentum shifts.
Key On-Chain Metrics for Dogecoin Analysis
To effectively combine on-chain data with technical analysis, it's essential to understand which metrics matter most:
- Wallet Activity: Rising number of active addresses suggests increased usage or speculation.
- Transaction Volume: Helps assess whether price movements are supported by actual on-chain demand.
- Supply Distribution: Large holders accumulating DOGE can signal bullish intent.
- Exchange Inflows/Outflows: Sharp increases in outflows may suggest long-term holding trends.
These metrics can be sourced from platforms like Glassnode, IntoTheBlock, or Etherscan (for Dogecoin-compatible chains). Each metric should be cross-referenced with chart patterns and traditional technical indicators to form a comprehensive strategy.
Integrating On-Chain Signals with RSI and Moving Averages
One practical way to merge on-chain signals with technical tools is to correlate spikes in on-chain transaction volume with RSI readings. For instance, if RSI hits 70 (overbought) but on-chain volume surges, it might indicate strong buying pressure that could sustain upward movement.
Here’s how to approach this integration step-by-step:
- Monitor Dogecoin’s RSI on a daily chart and note when it reaches key thresholds (above 70 or below 30).
- Simultaneously track on-chain transaction volume using tools like CoinMetrics or Santiment.
- If both RSI and on-chain volume suggest strength, consider it a confirmation of trend continuation.
- If RSI shows overbought conditions but on-chain volume declines, it may signal a false rally or bear trap.
This method allows traders to filter out noise and focus on high-probability setups backed by both behavioral and statistical evidence.
Using Moving Averages with Whale Movement Patterns
Large whale movements—transfers of significant amounts of DOGE—are often visible through on-chain analytics. These transfers can precede major price swings, especially when combined with moving averages.
To implement this strategy:
- Track large whale transactions via on-chain explorers or analytics dashboards.
- Overlay 50-day and 200-day Moving Averages on the Dogecoin price chart.
- Watch for whale accumulation during periods when price is near or below the 200-day MA.
- Look for crossovers between the 50-day and 200-day MA to confirm potential bull runs.
When whales move coins off exchanges and into cold storage, it often signals confidence in long-term value. This behavior, paired with positive moving average crossovers, can serve as a powerful indicator for entry points.
Applying Bollinger Bands Alongside Exchange Reserves
Exchange reserves refer to the amount of Dogecoin held on centralized exchanges. A drop in exchange reserves typically indicates that holders are withdrawing their DOGE, potentially signaling accumulation.
To integrate this with Bollinger Bands:
- Plot Bollinger Bands on your Dogecoin price chart to identify volatility contraction and expansion phases.
- Check exchange reserve levels using platforms like CryptoQuant or Nansen.
- If reserves fall while price consolidates within Bollinger Bands, prepare for a potential breakout.
- Use a break above the upper band as a buy signal, especially if confirmed by declining reserves.
This combination helps anticipate explosive moves before they occur by identifying low liquidity environments and tightening ranges.
Frequently Asked Questions
Q: Can on-chain data alone be used to trade Dogecoin?
A: While on-chain data offers valuable insights, it should not be used in isolation. It works best when combined with technical indicators and broader market context to avoid false signals and improve accuracy.
Q: What tools are recommended for tracking Dogecoin on-chain metrics?
A: Platforms such as Glassnode, Santiment, IntoTheBlock, and CryptoQuant provide reliable on-chain analytics for Dogecoin and other cryptocurrencies.
Q: How do I interpret whale movements in Dogecoin?
A: Whale movements should be analyzed based on direction (inflow vs. outflow), size relative to total supply, and timing. Sudden large withdrawals from exchanges may indicate accumulation or preparation for a price move.
Q: Are there specific timeframes where combining on-chain data with technicals is more effective?
A: Daily and weekly timeframes tend to yield clearer signals when merging on-chain data with technicals, as short-term noise is reduced and institutional or large holder behavior becomes more apparent.
Disclaimer:info@kdj.com
The information provided is not trading advice. kdj.com does not assume any responsibility for any investments made based on the information provided in this article. Cryptocurrencies are highly volatile and it is highly recommended that you invest with caution after thorough research!
If you believe that the content used on this website infringes your copyright, please contact us immediately (info@kdj.com) and we will delete it promptly.
- Ethereum, Exchanges, and Price Resilience: Navigating the Crypto Landscape
- 2025-07-08 08:30:13
- Bitcoin's NVT Golden Cross: Is a Local Top Brewing?
- 2025-07-08 09:10:11
- Semler Scientific's Bitcoin Bonanza: A Cryptocurrency Goal?
- 2025-07-08 09:10:11
- From Coin Flips to Cityscapes: How Names, Parks, and Planting Shaped St. Albert
- 2025-07-08 08:50:12
- Candles, Laundromats, and Inspiration: A Surprising New York Story
- 2025-07-08 09:15:11
- Iron Maiden Rocks the Royal Mint: A 50th Anniversary Coin That Kicks Ass
- 2025-07-08 09:15:11
Related knowledge

How to trade Dogecoin based on funding rates and open interest
Jul 07,2025 at 02:49am
Understanding Funding Rates in Dogecoin TradingFunding rates are periodic payments made to either long or short traders depending on the prevailing market conditions. In perpetual futures contracts, these rates help align the price of the contract with the spot price of Dogecoin (DOGE). When funding rates are positive, it indicates that long positions p...

What is the 'God Mode' indicator for Bitcoincoin
Jul 07,2025 at 04:42pm
Understanding the 'God Mode' IndicatorThe 'God Mode' indicator is a term that has emerged within cryptocurrency trading communities, particularly those focused on meme coins like Dogecoin (DOGE). While not an officially recognized technical analysis tool or formula, it refers to a set of conditions or patterns in price action and volume that some trader...

Using Gann Fans on the Dogecoin price chart
Jul 07,2025 at 09:43pm
Understanding Gann Fans and Their Relevance in Cryptocurrency TradingGann Fans are a technical analysis tool developed by W.D. Gann, a renowned trader from the early 20th century. These fans consist of diagonal lines that radiate out from a central pivot point on a price chart, typically drawn at specific angles such as 1x1 (45 degrees), 2x1, 1x2, and o...

How to spot manipulation on the Dogecoin chart
Jul 06,2025 at 12:35pm
Understanding the Basics of Chart ManipulationChart manipulation in the cryptocurrency space, particularly with Dogecoin, refers to artificial price movements caused by coordinated trading activities rather than genuine market demand. These manipulations are often executed by large holders (commonly known as whales) or organized groups aiming to mislead...

Bitcoincoin market structure break explained
Jul 07,2025 at 02:51am
Understanding the Dogecoin Market StructureDogecoin, initially created as a meme-based cryptocurrency, has evolved into a significant player in the crypto market. Its market structure refers to how price action is organized over time, including support and resistance levels, trend lines, and patterns that help traders anticipate future movements. A mark...

How to backtest a Dogecoin moving average strategy
Jul 08,2025 at 04:50am
What is a Moving Average Strategy in Cryptocurrency Trading?A moving average strategy is one of the most commonly used technical analysis tools in cryptocurrency trading. It involves analyzing the average price of an asset, such as Dogecoin (DOGE), over a specified time period to identify trends and potential entry or exit points. Traders often use diff...

How to trade Dogecoin based on funding rates and open interest
Jul 07,2025 at 02:49am
Understanding Funding Rates in Dogecoin TradingFunding rates are periodic payments made to either long or short traders depending on the prevailing market conditions. In perpetual futures contracts, these rates help align the price of the contract with the spot price of Dogecoin (DOGE). When funding rates are positive, it indicates that long positions p...

What is the 'God Mode' indicator for Bitcoincoin
Jul 07,2025 at 04:42pm
Understanding the 'God Mode' IndicatorThe 'God Mode' indicator is a term that has emerged within cryptocurrency trading communities, particularly those focused on meme coins like Dogecoin (DOGE). While not an officially recognized technical analysis tool or formula, it refers to a set of conditions or patterns in price action and volume that some trader...

Using Gann Fans on the Dogecoin price chart
Jul 07,2025 at 09:43pm
Understanding Gann Fans and Their Relevance in Cryptocurrency TradingGann Fans are a technical analysis tool developed by W.D. Gann, a renowned trader from the early 20th century. These fans consist of diagonal lines that radiate out from a central pivot point on a price chart, typically drawn at specific angles such as 1x1 (45 degrees), 2x1, 1x2, and o...

How to spot manipulation on the Dogecoin chart
Jul 06,2025 at 12:35pm
Understanding the Basics of Chart ManipulationChart manipulation in the cryptocurrency space, particularly with Dogecoin, refers to artificial price movements caused by coordinated trading activities rather than genuine market demand. These manipulations are often executed by large holders (commonly known as whales) or organized groups aiming to mislead...

Bitcoincoin market structure break explained
Jul 07,2025 at 02:51am
Understanding the Dogecoin Market StructureDogecoin, initially created as a meme-based cryptocurrency, has evolved into a significant player in the crypto market. Its market structure refers to how price action is organized over time, including support and resistance levels, trend lines, and patterns that help traders anticipate future movements. A mark...

How to backtest a Dogecoin moving average strategy
Jul 08,2025 at 04:50am
What is a Moving Average Strategy in Cryptocurrency Trading?A moving average strategy is one of the most commonly used technical analysis tools in cryptocurrency trading. It involves analyzing the average price of an asset, such as Dogecoin (DOGE), over a specified time period to identify trends and potential entry or exit points. Traders often use diff...
See all articles


