


![[Multi SUB] |He got divorced and got into a car accident to activate the Shennong inheritance! Arrange a marriage with a beautiful CEO, join forces to tear apart the disguise of his ex-wife and her family at the wedding, and start a counterattack in life! #剧energychargingstation#MiniDrama#Wonderful mainland short drama](/uploads/2026/06/22/cryptocurrencies-news/videos/origin_6a38bcf1d3477_image_500_375.webp "[Multi SUB] |He got divorced and got into a car accident to activate the Shennong inheritance! Arrange a marriage with a beautiful CEO, join forces to tear apart the disguise of his ex-wife and her family at the wedding, and start a counterattack in life! #剧energychargingstation#MiniDrama#Wonderful mainland short drama")


![ENG SUB 🔥[First release on the whole network]](/uploads/2026/06/22/cryptocurrencies-news/videos/origin_6a38bcf17d2be_image_500_375.webp "ENG SUB 🔥[First release on the whole network]")


-
 bitcoin
 $87959.907984 USD
1.34% - ethereum
$2920.497338 USD
3.04% - tether
$0.999775 USD
0.00% - xrp
$2.237324 USD
8.12% - bnb
$860.243768 USD
0.90% - solana
$138.089498 USD
5.43% - usd-coin
$0.999807 USD
0.01% - tron
$0.272801 USD
-1.53% - dogecoin
$0.150904 USD
2.96% - cardano
$0.421635 USD
1.97% - hyperliquid
$32.152445 USD
2.23% - bitcoin-cash
$533.301069 USD
-1.94% - chainlink
$12.953417 USD
2.68% - unus-sed-leo
$9.535951 USD
0.73% - zcash
$521.483386 USD
-2.87%


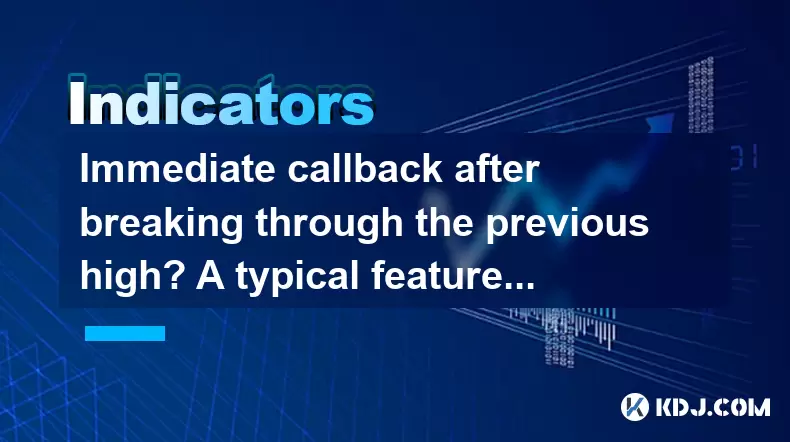
Immediate callback after breaking through the previous high? A typical feature of the main force's wash!
A sudden pullback after breaking a prior high often signals the main force washing—manipulating price to shake weak hands before resuming the trend.
Jun 12, 2025 at 08:57 am
Understanding the Immediate Callback After Breaking Through the Previous High
When analyzing cryptocurrency price charts, one pattern that frequently catches traders' attention is the immediate callback after breaking through the previous high. This phenomenon often signals a strategic move by large market players — commonly referred to as 'the main force' — to manipulate or control price movement through a process known as 'washing' (or wash trading). In this context, 'wash' refers to the act of shaking out weak hands or triggering stop-loss orders before resuming an uptrend.
The immediate pullback following a breakout is not random; it's often a calculated move designed to test market sentiment and liquidity. Traders observing such behavior should pay close attention to volume patterns, candlestick formations, and support/resistance levels during these moments.
Identifying the Main Force’s Wash Pattern in Cryptocurrency Charts
To spot the main force's wash, you need to understand how institutional-level actors operate in decentralized markets. These entities often create artificial volatility by pushing prices past key resistance levels only to reverse course shortly afterward. The purpose of this maneuver is to trigger automated stop-loss orders and scare retail traders into selling their positions at unfavorable prices.
One typical example occurs when a cryptocurrency like Bitcoin or Ethereum breaks above a significant resistance level. Instead of continuing upward, the price suddenly drops back below the breakout point. During this phase, you might notice spikes in trading volume followed by sharp declines, which are telltale signs of manipulation.
Key indicators to monitor include:
- Volume surges during the breakout
- Long upper wicks on candles right after the breakout
- Quick retrace to the original resistance-turned-support zone
This kind of price action is especially common in altcoins with lower liquidity, where large holders can more easily influence the market.
How to Differentiate Between Genuine Breakouts and Wash Sales
Not every breakout followed by a pullback is a wash sale orchestrated by the main force. Therefore, it's crucial to distinguish between genuine momentum-driven moves and manipulative ones. One way to do this is by examining on-chain data and order book depth.
In a real breakout scenario, you'll typically see sustained buying pressure even after the initial spike. Conversely, in a wash sale, the buying momentum dries up quickly, and the price retreats without strong support forming at the new level.
Another method involves looking at whale transactions. If a few large wallets are responsible for most of the volume during the breakout, it could indicate coordinated efforts to shake the market rather than organic demand growth.
Additional factors to consider:
- Presence of fake volume from certain exchanges
- Lack of follow-through from major buyers
- Rejection candles forming near the breakout level
By combining technical analysis with on-chain metrics, traders can better assess whether a breakout is legitimate or part of a larger wash strategy.
Practical Steps to Navigate the Immediate Callback
For traders who recognize the immediate callback after breaking through the previous high, there are several strategies to manage risk and potentially profit from the situation. The key lies in understanding how to position yourself during the pullback phase.
One effective approach is to wait for a retest of the broken resistance level. If the price holds above that level during the callback, it may signal a valid continuation pattern. Placing buy orders slightly above the retested zone can offer favorable entry points.
Here’s how to structure your trade setup:
- Monitor the initial breakout and note the volume
- Observe if the price returns to the breakout level
- Watch for bullish candlestick patterns during the retest
- Enter long positions once confirmation appears
- Set stop-loss just below the recent swing low
It’s also wise to avoid entering trades immediately after a breakout unless there’s clear evidence of strong buying pressure. Patience and precision are essential in volatile crypto markets.
Tools and Indicators That Help Recognize the Wash Pattern
Several tools and technical indicators can assist traders in identifying and confirming the main force's wash. Among the most useful are:
- Volume Profile: Helps identify areas of value and potential manipulation zones
- Order Block Detection Tools: Show where large players have historically placed orders
- On-Balance Volume (OBV): Tracks cumulative buying and selling pressure
- Market Depth Analysis: Reveals hidden liquidity and potential spoofing activity
Using these tools together can provide a clearer picture of whether a breakout is sustainable or simply a trap set by institutional players. For instance, if OBV shows declining momentum while price makes a new high, it may indicate divergence — a red flag for wash-like behavior.
Additionally, integrating blockchain analytics platforms like Glassnode or Whale Alert can reveal abnormal wallet activities that coincide with price movements. These insights are invaluable for traders aiming to stay ahead of the curve.
Frequently Asked Questions
Q: Is the immediate callback always a sign of the main force washing?A: No, callbacks can occur due to natural market dynamics like profit-taking or shifting sentiment. However, repeated patterns combined with unusual volume spikes may suggest manipulation.
Q: Can I use this pattern to predict future breakouts?A: While the pattern itself doesn’t guarantee future performance, recognizing it can help anticipate short-term reversals and improve timing for entries or exits.
Q: Which cryptocurrencies are most prone to wash-style callbacks?A: Altcoins with lower market caps and less liquidity are more susceptible. Major coins like BTC and ETH are not immune but tend to exhibit more organic price action.
Q: Are there legal implications for wash trading in cryptocurrency markets?A: Yes, many jurisdictions consider wash trading illegal, especially on centralized exchanges. However, enforcement remains challenging in decentralized environments.
Disclaimer:info@kdj.com
The information provided is not trading advice. kdj.com does not assume any responsibility for any investments made based on the information provided in this article. Cryptocurrencies are highly volatile and it is highly recommended that you invest with caution after thorough research!
If you believe that the content used on this website infringes your copyright, please contact us immediately (info@kdj.com) and we will delete it promptly.


- Bitcoin, eCash Fork, and Airdrop Dynamics: A Deep Dive into Crypto's Latest Controversies
- 2026-05-03 12:55:01
- Consensus 2026 Miami: Web3, Blockchain, Cryptocurrency, NFTs, Metaverse, Conference, May 5th — Where Wall Street Meets the Digital Frontier
- 2026-05-02 12:45:01
- Fed Holds Rates Steady, Triggering Bitcoin Price Drop Amidst Geopolitical Tensions
- 2026-05-01 06:45:01
- Bitcoin Miners Electrify the Grid: Ohio Gas Plant Acquisition Powers Up a New Era for Digital Gold
- 2026-05-01 00:45:01
- MegaETH's MEGA Token Hits the Big Apple: Setting New Performance Benchmarks for Real-Time Blockchain
- 2026-05-01 00:55:01
- Solana's Slippery Slope: Price Prediction Points to Resistance Loss and Potential Further Drops
- 2026-05-01 06:45:01
Related knowledge

What Are the Most Popular Crypto Indicators in 2026? Which Ones Still Work?
Jun 15,2026 at 04:40pm
RSI: The Enduring Momentum Gauge1. RSI remains one of the most widely adopted indicators across all timeframes, from scalping to position trading. 2. ...

How to Build a Crypto Trading Strategy Around Technical Indicators?
Jun 21,2026 at 05:59am
Indicator Selection and Market Context1. RSI values below 30 signal oversold conditions across BTC/USDT 1-hour charts, yet historical backtests show f...

What Is the Aroon Indicator? Can It Help Predict New Trends?
Jun 13,2026 at 01:37am
Market Volatility Patterns1. Bitcoin price swings often exceed 5% within a single trading session during high-liquidity events such as ETF inflow anno...

How to Use Fibonacci Extensions for Crypto Profit Targets?
Jun 18,2026 at 03:59pm
Market Volatility Patterns1. Bitcoin’s price movements often exhibit sharp intraday swings exceeding 5% during major macroeconomic announcements. 2. E...

How to Confirm Trend Reversals Before Entering a Trade?
Jun 12,2026 at 02:39pm
Market Volatility Patterns1. Bitcoin’s price movements often reflect macroeconomic signals such as Federal Reserve interest rate decisions and inflati...

What Is a Volume Spike? Does It Signal a Major Price Move?
Jun 14,2026 at 03:20pm
Understanding Volume Spikes in Cryptocurrency Markets1. A volume spike refers to a sudden and substantial increase in the number of tokens traded with...
What Are the Most Popular Crypto Indicators in 2026? Which Ones Still Work?
Jun 15,2026 at 04:40pm
RSI: The Enduring Momentum Gauge1. RSI remains one of the most widely adopted indicators across all timeframes, from scalping to position trading. 2. ...
How to Build a Crypto Trading Strategy Around Technical Indicators?
Jun 21,2026 at 05:59am
Indicator Selection and Market Context1. RSI values below 30 signal oversold conditions across BTC/USDT 1-hour charts, yet historical backtests show f...
What Is the Aroon Indicator? Can It Help Predict New Trends?
Jun 13,2026 at 01:37am
Market Volatility Patterns1. Bitcoin price swings often exceed 5% within a single trading session during high-liquidity events such as ETF inflow anno...
How to Use Fibonacci Extensions for Crypto Profit Targets?
Jun 18,2026 at 03:59pm
Market Volatility Patterns1. Bitcoin’s price movements often exhibit sharp intraday swings exceeding 5% during major macroeconomic announcements. 2. E...
How to Confirm Trend Reversals Before Entering a Trade?
Jun 12,2026 at 02:39pm
Market Volatility Patterns1. Bitcoin’s price movements often reflect macroeconomic signals such as Federal Reserve interest rate decisions and inflati...
What Is a Volume Spike? Does It Signal a Major Price Move?
Jun 14,2026 at 03:20pm
Understanding Volume Spikes in Cryptocurrency Markets1. A volume spike refers to a sudden and substantial increase in the number of tokens traded with...
See all articles


