-
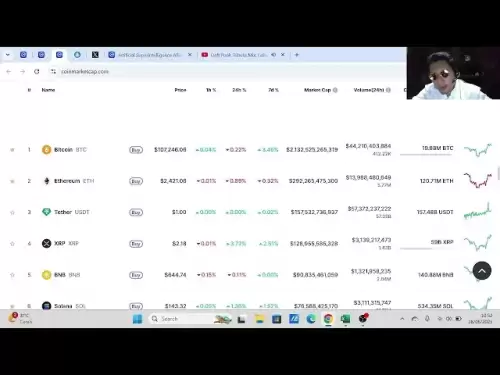
 Bitcoin
 $107,461.2530
0.65% -
 Ethereum
 $2,425.6945
-0.64% -
 Tether USDt
 $1.0003
-0.01% -
 XRP
XRP $2.1844
4.49% -
 BNB
BNB $646.3777
0.36% -
 Solana
 $146.6972
3.90% -
 USDC
USDC $1.0000
0.00% -
 TRON
TRON $0.2744
1.17% -
 Dogecoin
 $0.1631
1.28% -
 Cardano
 $0.5609
1.22% -
 Hyperliquid
 $37.0726
2.08% -
 Bitcoin Cash
 $497.3222
-0.12% -
 Sui
Sui $2.7220
3.19% -
 Chainlink
 $13.1487
0.79% -
 UNUS SED LEO
 $9.0787
0.68% -
 Avalanche
 $17.6542
1.11% -
 Stellar
 $0.2377
1.49% -
 Toncoin
 $2.8426
0.81% -
 Shiba Inu
 $0.0...01140
1.72% -
 Litecoin
 $85.2565
0.62% -
 Hedera
 $0.1475
2.69% -
 Monero
 $314.1893
2.28% -
 Bitget Token
 $4.6752
0.90% -
 Dai
Dai $1.0001
0.02% -
 Polkadot
 $3.3425
1.28% -
 Ethena USDe
 $1.0001
0.02% -
 Uniswap
 $6.9500
1.23% -
 Pi
Pi $0.5304
-3.13% -
 Pepe
Pepe $0.0...09311
0.91% -
 Aave
Aave $254.6674
-1.33%
How to view market depth on Kraken? Analyze the distribution of buy and sell orders
Market depth on Kraken shows buy and sell orders, helping traders gauge liquidity and potential price movements for informed trading decisions.
May 12, 2025 at 02:49 am
Understanding Market Depth on Kraken
Market depth is a critical tool for traders looking to understand the liquidity and potential price movements of a cryptocurrency on an exchange like Kraken. It provides a visual representation of the current buy and sell orders at different price levels. This information is vital for making informed trading decisions, as it helps traders gauge the supply and demand at various price points.
Accessing the Market Depth Chart on Kraken
To view the market depth on Kraken, follow these detailed steps:
- Log into your Kraken account: Ensure you are logged into your Kraken account. Navigate to the trading section.
- Select the trading pair: Choose the cryptocurrency pair you are interested in, such as BTC/USD.
- Access the order book: On the trading interface, locate the order book section. This is usually on the right side of the screen.
- Switch to the depth chart: Kraken provides an option to switch from the standard order book view to a depth chart. Look for a tab or button labeled "Depth" or "Depth Chart" and click on it.
Once you are on the depth chart, you will see a graphical representation of the market depth. The chart typically displays two colors: one for buy orders and another for sell orders. The horizontal axis represents the price, while the vertical axis shows the cumulative volume of orders at each price level.
Analyzing Buy Orders on the Depth Chart
The buy orders are usually represented in green on the depth chart. These orders indicate the willingness of traders to purchase the cryptocurrency at various price levels. To analyze the distribution of buy orders:
- Identify the highest buy order: Look at the rightmost edge of the green section on the chart. This point represents the highest price at which a buy order is placed.
- Observe the density of buy orders: The thickness of the green area indicates the concentration of buy orders at different price levels. A thicker section suggests a higher volume of buy orders, indicating strong support at that price level.
- Analyze the slope of the buy side: A steep slope suggests that the buy orders are concentrated within a narrow price range, while a gradual slope indicates a more evenly distributed set of buy orders across a wider range of prices.
Analyzing Sell Orders on the Depth Chart
The sell orders are typically shown in red on the depth chart. These orders represent the willingness of traders to sell the cryptocurrency at various price levels. To analyze the distribution of sell orders:
- Identify the lowest sell order: Look at the leftmost edge of the red section on the chart. This point represents the lowest price at which a sell order is placed.
- Observe the density of sell orders: The thickness of the red area indicates the concentration of sell orders at different price levels. A thicker section suggests a higher volume of sell orders, indicating potential resistance at that price level.
- Analyze the slope of the sell side: A steep slope suggests that the sell orders are concentrated within a narrow price range, while a gradual slope indicates a more evenly distributed set of sell orders across a wider range of prices.
Interpreting Market Depth Data
Understanding the distribution of buy and sell orders on the depth chart can provide valuable insights into market sentiment and potential price movements. Here are some key points to consider:
- Imbalance between buy and sell orders: If the buy side of the chart is significantly thicker than the sell side, it may indicate strong buying pressure and potential upward price movement. Conversely, a thicker sell side may suggest selling pressure and potential downward price movement.
- Order clustering: Pay attention to areas where buy or sell orders are clustered. These clusters can act as support or resistance levels, influencing future price movements.
- Order wall: An order wall is a large buy or sell order at a specific price level. These can act as significant barriers to price movement, as a large order must be filled before the price can move past that level.
Using Market Depth for Trading Decisions
Market depth data can be used to inform various trading strategies. Here are some ways traders might use this information:
- Scalping: Traders can use the depth chart to identify short-term price movements by taking advantage of small imbalances between buy and sell orders.
- Swing trading: By identifying key support and resistance levels from the depth chart, traders can plan entry and exit points for longer-term trades.
- Order placement: Traders can strategically place their buy and sell orders based on the distribution of orders on the depth chart, aiming to get the best possible price.
Frequently Asked Questions
Q: Can I customize the depth chart on Kraken?
A: Yes, Kraken allows users to customize the depth chart to some extent. You can adjust the time frame and zoom in or out to focus on specific price ranges. However, the basic functionality and appearance of the chart remain consistent with the default settings.
Q: How often is the market depth data updated on Kraken?
A: The market depth data on Kraken is updated in real-time, reflecting the latest buy and sell orders as they are placed, modified, or canceled. This ensures that traders have access to the most current market information.
Q: Can I use market depth data from Kraken for automated trading?
A: Yes, many traders use market depth data from Kraken for automated trading strategies. By integrating Kraken's API, traders can access real-time market depth data and use it to execute trades automatically based on predefined criteria.
Q: Is market depth data available for all trading pairs on Kraken?
A: Market depth data is available for most trading pairs on Kraken. However, the availability and quality of the data may vary depending on the liquidity and trading volume of the specific pair. Always check the order book and depth chart for the pair you are interested in trading.
Disclaimer:info@kdj.com
The information provided is not trading advice. kdj.com does not assume any responsibility for any investments made based on the information provided in this article. Cryptocurrencies are highly volatile and it is highly recommended that you invest with caution after thorough research!
If you believe that the content used on this website infringes your copyright, please contact us immediately (info@kdj.com) and we will delete it promptly.
- Across Crypto Project Faces Heat: Secret $23M Transfer Sparks Governance Debate
- 2025-06-28 16:30:13
- Trump Coin's Wild Ride: Liquidity Drain, Exchange Deposits, and What It Means for Binance & OKX
- 2025-06-28 16:50:13
- Trump, Memecoin Mania, and Whale Watching: A New York Minute in Crypto
- 2025-06-28 16:30:13
- Shiba Inu, Lending Coins, and Early Holders: A New Frontier
- 2025-06-28 16:51:59
- Meme Coins in July 2025: Investing in the Future of Hype?
- 2025-06-28 16:51:59
- SUI's Trending Surge: Decoding the Reasons Behind the Hype
- 2025-06-28 16:55:12
Related knowledge
Binance spot market analysis: seize the best time to buy and sell
Jun 19,2025 at 04:56pm
Understanding the Binance Spot MarketThe Binance spot market is one of the most popular platforms for cryptocurrency trading globally. It allows users to trade digital assets at current market prices, making it essential for traders aiming to buy low and sell high. Unlike futures or margin trading, spot trading involves direct ownership of the asset aft...
Binance fund management secrets: reasonable allocation to increase income
Jun 22,2025 at 02:29pm
Understanding Binance Fund ManagementBinance fund management involves strategic allocation of your cryptocurrency assets to optimize returns while managing risk. The key to successful fund management lies in understanding how different investment options on the Binance platform can be utilized to create a diversified portfolio. This includes spot tradin...
Binance trading pair selection skills: find the best buying and selling combination
Jun 23,2025 at 02:49am
Understanding the Basics of Trading Pairs on BinanceBefore diving into trading pair selection skills, it's essential to understand what a trading pair is. On Binance, a trading pair refers to two cryptocurrencies that can be traded against each other. For example, BTC/USDT means Bitcoin is being traded against Tether. Each trading pair has its own liqui...
Binance new coin mining strategy: participate in Launchpool to earn income
Jun 23,2025 at 11:56am
What is Binance Launchpool and how does it work?Binance Launchpool is a feature introduced by the world’s largest cryptocurrency exchange, Binance, to allow users to earn new tokens through staking. This platform enables users to stake their existing cryptocurrencies (such as BNB, BUSD, or other supported assets) in exchange for newly launched tokens. T...
Binance financial management guide: ways to increase the value of idle assets
Jun 19,2025 at 11:22pm
Understanding Idle Assets in the Cryptocurrency SpaceIn the fast-paced world of cryptocurrency, idle assets refer to digital currencies that are not actively being used for trading, staking, or yield farming. Holding these funds in a wallet without utilizing them means missing out on potential growth opportunities. Binance, as one of the leading platfor...
Binance flash exchange function guide: quick exchange of digital currencies
Jun 23,2025 at 12:29pm
What is the Binance Flash Exchange Function?The Binance Flash Exchange function is a powerful tool designed to allow users to instantly swap between supported cryptocurrencies without the need for placing traditional buy/sell orders. This feature simplifies the trading process by offering a direct exchange mechanism, eliminating the requirement to conve...

Binance spot market analysis: seize the best time to buy and sell
Jun 19,2025 at 04:56pm
Understanding the Binance Spot MarketThe Binance spot market is one of the most popular platforms for cryptocurrency trading globally. It allows users to trade digital assets at current market prices, making it essential for traders aiming to buy low and sell high. Unlike futures or margin trading, spot trading involves direct ownership of the asset aft...

Binance fund management secrets: reasonable allocation to increase income
Jun 22,2025 at 02:29pm
Understanding Binance Fund ManagementBinance fund management involves strategic allocation of your cryptocurrency assets to optimize returns while managing risk. The key to successful fund management lies in understanding how different investment options on the Binance platform can be utilized to create a diversified portfolio. This includes spot tradin...

Binance trading pair selection skills: find the best buying and selling combination
Jun 23,2025 at 02:49am
Understanding the Basics of Trading Pairs on BinanceBefore diving into trading pair selection skills, it's essential to understand what a trading pair is. On Binance, a trading pair refers to two cryptocurrencies that can be traded against each other. For example, BTC/USDT means Bitcoin is being traded against Tether. Each trading pair has its own liqui...

Binance new coin mining strategy: participate in Launchpool to earn income
Jun 23,2025 at 11:56am
What is Binance Launchpool and how does it work?Binance Launchpool is a feature introduced by the world’s largest cryptocurrency exchange, Binance, to allow users to earn new tokens through staking. This platform enables users to stake their existing cryptocurrencies (such as BNB, BUSD, or other supported assets) in exchange for newly launched tokens. T...

Binance financial management guide: ways to increase the value of idle assets
Jun 19,2025 at 11:22pm
Understanding Idle Assets in the Cryptocurrency SpaceIn the fast-paced world of cryptocurrency, idle assets refer to digital currencies that are not actively being used for trading, staking, or yield farming. Holding these funds in a wallet without utilizing them means missing out on potential growth opportunities. Binance, as one of the leading platfor...

Binance flash exchange function guide: quick exchange of digital currencies
Jun 23,2025 at 12:29pm
What is the Binance Flash Exchange Function?The Binance Flash Exchange function is a powerful tool designed to allow users to instantly swap between supported cryptocurrencies without the need for placing traditional buy/sell orders. This feature simplifies the trading process by offering a direct exchange mechanism, eliminating the requirement to conve...
See all articles


