-
 Bitcoin
 $108,708.8110
0.60% -
 Ethereum
 $2,561.6057
1.91% -
 Tether USDt
 $1.0001
-0.03% -
 XRP
XRP $2.2795
0.57% -
 BNB
BNB $662.2393
1.00% -
 Solana
 $153.1346
3.74% -
 USDC
USDC $1.0000
0.00% -
 TRON
TRON $0.2877
0.97% -
 Dogecoin
 $0.1710
3.93% -
 Cardano
 $0.5871
1.61% -
 Hyperliquid
 $39.6663
1.68% -
 Sui
Sui $2.9032
0.79% -
 Bitcoin Cash
 $496.1879
1.71% -
 Chainlink
 $13.5807
3.01% -
 UNUS SED LEO
 $9.0777
0.61% -
 Stellar
 $0.2514
4.51% -
 Avalanche
 $18.1761
1.86% -
 Shiba Inu
 $0.0...01173
1.72% -
 Toncoin
 $2.8010
-4.23% -
 Hedera
 $0.1594
3.21% -
 Litecoin
 $87.0257
-0.53% -
 Monero
 $319.1217
1.79% -
 Polkadot
 $3.3853
0.68% -
 Dai
Dai $0.9999
-0.01% -
 Ethena USDe
 $1.0003
0.02% -
 Bitget Token
 $4.3420
-0.97% -
 Uniswap
 $7.3772
1.39% -
 Aave
Aave $286.6277
5.61% -
 Pepe
Pepe $0.0...09994
2.33% -
 Pi
Pi $0.4589
1.76%
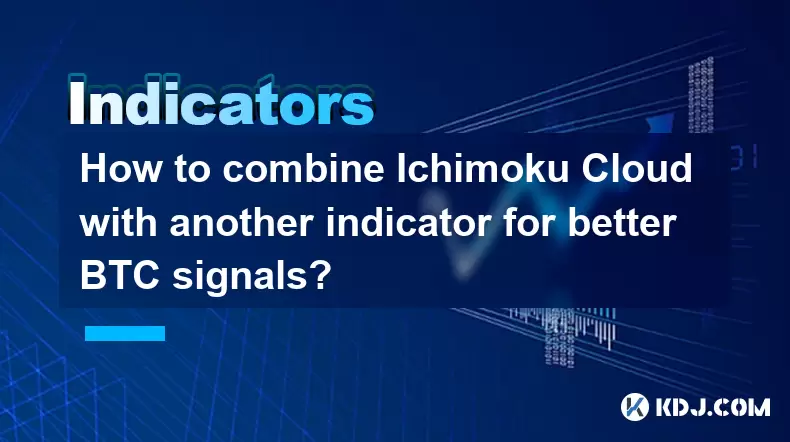
How to combine Ichimoku Cloud with another indicator for better BTC signals?
The Ichimoku Cloud, combined with RSI or MACD, offers BTC traders powerful insights into trends, momentum, and reliable entry/exit points.
Jul 07, 2025 at 11:07 pm

Understanding the Ichimoku Cloud and Its Components
The Ichimoku Cloud, also known as Ichimoku Kinko Hyo, is a comprehensive technical analysis tool that provides insights into support/resistance levels, momentum, and trend direction. It consists of five key components: Tenkan-sen (Conversion Line), Kijun-sen (Base Line), Senkou Span A (Leading Span A), Senkou Span B (Leading Span B), and Chikou Span (Lagging Span). Each part plays a unique role in identifying potential price movements in BTC.
For Bitcoin traders, understanding how these lines interact with each other and with price action is essential. When the price is above the cloud (Senkou Span A and B), it suggests a bullish trend, while being below the cloud indicates a bearish trend. The thickness and color of the cloud also matter—a thick green cloud indicates strong support, whereas a thick red cloud signals strong resistance.
Selecting a Complementary Indicator for BTC Trading
To enhance the reliability of signals generated by the Ichimoku Cloud, it’s beneficial to combine it with another technical indicator. Popular choices include Relative Strength Index (RSI), Moving Average Convergence Divergence (MACD), and Volume indicators. These tools help confirm trends, detect overbought/oversold conditions, or highlight divergences.
For example, the RSI helps identify when BTC might be overbought (above 70) or oversold (below 30). Combining RSI readings with Ichimoku signals can filter out false breakouts. Similarly, MACD crossovers can validate the strength of a trend suggested by the cloud. Traders should test various combinations on historical data before applying them to live trading.
How to Combine Ichimoku Cloud with RSI for BTC Signals
Using Ichimoku Cloud with RSI creates a robust strategy for identifying high-probability entry and exit points in BTC trades. Here's how to apply this combination effectively:
- Ensure that the price is above the cloud for a bullish setup, or below the cloud for a bearish setup
- Look for the Tenkan-sen crossing above the Kijun-sen as a potential buy signal
- Confirm the signal by checking if the RSI is rising from below 50 or not overbought
- Wait for the Chikou Span to confirm by crossing above or below the price on the chart
This combination reduces false signals and ensures that entries are supported by both momentum and trend confirmation. For instance, during a sharp rally in BTC, if the cloud turns green but RSI spikes above 70, it may indicate an overextended move, prompting caution even if the cloud suggests a bullish trend.
Combining Ichimoku Cloud with MACD for BTC Confirmation
The Moving Average Convergence Divergence (MACD) works well alongside the Ichimoku Cloud by adding momentum analysis to trend identification. To use this combination effectively for BTC:
- Watch for a bullish Ichimoku crossover (Tenkan-sen crosses above Kijun-sen)
- Confirm the signal with a MACD line crossing above the signal line
- Check if the histogram is expanding, indicating increasing momentum
- Ensure that the price is trading above the cloud and the Chikou Span confirms the move
This dual-filter system increases the probability of successful trades. For example, if the cloud is turning bullish but the MACD shows divergence, it could warn of a potential reversal, offering safer entry or exit opportunities.
Integrating Volume Analysis with Ichimoku for BTC
Volume plays a crucial role in confirming the validity of any technical signal. When used with the Ichimoku Cloud, volume can help determine whether a breakout or trend continuation in BTC has enough market conviction.
Here's how to incorporate volume into your Ichimoku-based BTC trading strategy:
- Observe a breakout above/below the cloud and check if there is a corresponding spike in volume
- If the price moves through the cloud without significant volume, the move may lack sustainability
- Use volume indicators like OBV (On-Balance Volume) or Volume Weighted Average Price (VWAP) to further validate Ichimoku signals
- In consolidation phases, declining volume often precedes a breakout; watch for volume surges to anticipate direction
A surge in volume during a Kumo breakout adds credibility to the trade. Conversely, low-volume breakouts may result in false signals or quick reversals.
Frequently Asked Questions
Q1: Can I use Ichimoku Cloud alone for BTC trading?
While the Ichimoku Cloud offers valuable insights into trend, momentum, and support/resistance, relying solely on it can lead to missed opportunities or false signals. Combining it with other indicators enhances accuracy.
Q2: What timeframes work best with Ichimoku Cloud for BTC?
The Ichimoku Cloud is effective across multiple timeframes. However, for day trading, the 1-hour or 4-hour charts are preferred, while swing traders often rely on the daily chart for clearer trend signals.
Q3: How do I adjust Ichimoku settings for BTC volatility?
Bitcoin’s volatility may require adjusting standard Ichimoku parameters. Some traders reduce the periods for Tenkan-sen and Kijun-sen (e.g., from 9 and 26 to 7 and 21) for faster responses to price changes.
Q4: Is Ichimoku suitable for all cryptocurrencies?
While originally designed for stocks, the Ichimoku Cloud works well with most liquid cryptocurrencies like BTC, ETH, and LTC. Less liquid altcoins may produce erratic signals due to irregular price behavior.
Disclaimer:info@kdj.com
The information provided is not trading advice. kdj.com does not assume any responsibility for any investments made based on the information provided in this article. Cryptocurrencies are highly volatile and it is highly recommended that you invest with caution after thorough research!
If you believe that the content used on this website infringes your copyright, please contact us immediately (info@kdj.com) and we will delete it promptly.
- Ripple, XRP, and AI Tokens: Is Ruvi AI the Next Big Thing?
- 2025-07-08 05:30:12
- Crypto Investment: BlockDAG, Litecoin, and the Solana Meme Coin Mania
- 2025-07-08 06:10:12
- Altcoins in Focus: BlockDAG, Litecoin, and the Shifting Crypto Landscape
- 2025-07-08 05:35:12
- BNB's Bullish Breakout: Riding the $600 Support Level Wave
- 2025-07-08 04:55:13
- Solana ETF on Hold: SEC Delay and Crypto Regulation Scrutiny
- 2025-07-08 06:10:12
- Altcoin, Date, Price: Navigating the Crypto Bill & Meme Coin Mania
- 2025-07-08 06:15:12
Related knowledge

How to trade Dogecoin based on funding rates and open interest
Jul 07,2025 at 02:49am
Understanding Funding Rates in Dogecoin TradingFunding rates are periodic payments made to either long or short traders depending on the prevailing market conditions. In perpetual futures contracts, these rates help align the price of the contract with the spot price of Dogecoin (DOGE). When funding rates are positive, it indicates that long positions p...

What is the 'God Mode' indicator for Bitcoincoin
Jul 07,2025 at 04:42pm
Understanding the 'God Mode' IndicatorThe 'God Mode' indicator is a term that has emerged within cryptocurrency trading communities, particularly those focused on meme coins like Dogecoin (DOGE). While not an officially recognized technical analysis tool or formula, it refers to a set of conditions or patterns in price action and volume that some trader...

Using Gann Fans on the Dogecoin price chart
Jul 07,2025 at 09:43pm
Understanding Gann Fans and Their Relevance in Cryptocurrency TradingGann Fans are a technical analysis tool developed by W.D. Gann, a renowned trader from the early 20th century. These fans consist of diagonal lines that radiate out from a central pivot point on a price chart, typically drawn at specific angles such as 1x1 (45 degrees), 2x1, 1x2, and o...

How to spot manipulation on the Dogecoin chart
Jul 06,2025 at 12:35pm
Understanding the Basics of Chart ManipulationChart manipulation in the cryptocurrency space, particularly with Dogecoin, refers to artificial price movements caused by coordinated trading activities rather than genuine market demand. These manipulations are often executed by large holders (commonly known as whales) or organized groups aiming to mislead...

Bitcoincoin market structure break explained
Jul 07,2025 at 02:51am
Understanding the Dogecoin Market StructureDogecoin, initially created as a meme-based cryptocurrency, has evolved into a significant player in the crypto market. Its market structure refers to how price action is organized over time, including support and resistance levels, trend lines, and patterns that help traders anticipate future movements. A mark...

How to backtest a Dogecoin moving average strategy
Jul 08,2025 at 04:50am
What is a Moving Average Strategy in Cryptocurrency Trading?A moving average strategy is one of the most commonly used technical analysis tools in cryptocurrency trading. It involves analyzing the average price of an asset, such as Dogecoin (DOGE), over a specified time period to identify trends and potential entry or exit points. Traders often use diff...

How to trade Dogecoin based on funding rates and open interest
Jul 07,2025 at 02:49am
Understanding Funding Rates in Dogecoin TradingFunding rates are periodic payments made to either long or short traders depending on the prevailing market conditions. In perpetual futures contracts, these rates help align the price of the contract with the spot price of Dogecoin (DOGE). When funding rates are positive, it indicates that long positions p...

What is the 'God Mode' indicator for Bitcoincoin
Jul 07,2025 at 04:42pm
Understanding the 'God Mode' IndicatorThe 'God Mode' indicator is a term that has emerged within cryptocurrency trading communities, particularly those focused on meme coins like Dogecoin (DOGE). While not an officially recognized technical analysis tool or formula, it refers to a set of conditions or patterns in price action and volume that some trader...

Using Gann Fans on the Dogecoin price chart
Jul 07,2025 at 09:43pm
Understanding Gann Fans and Their Relevance in Cryptocurrency TradingGann Fans are a technical analysis tool developed by W.D. Gann, a renowned trader from the early 20th century. These fans consist of diagonal lines that radiate out from a central pivot point on a price chart, typically drawn at specific angles such as 1x1 (45 degrees), 2x1, 1x2, and o...

How to spot manipulation on the Dogecoin chart
Jul 06,2025 at 12:35pm
Understanding the Basics of Chart ManipulationChart manipulation in the cryptocurrency space, particularly with Dogecoin, refers to artificial price movements caused by coordinated trading activities rather than genuine market demand. These manipulations are often executed by large holders (commonly known as whales) or organized groups aiming to mislead...

Bitcoincoin market structure break explained
Jul 07,2025 at 02:51am
Understanding the Dogecoin Market StructureDogecoin, initially created as a meme-based cryptocurrency, has evolved into a significant player in the crypto market. Its market structure refers to how price action is organized over time, including support and resistance levels, trend lines, and patterns that help traders anticipate future movements. A mark...

How to backtest a Dogecoin moving average strategy
Jul 08,2025 at 04:50am
What is a Moving Average Strategy in Cryptocurrency Trading?A moving average strategy is one of the most commonly used technical analysis tools in cryptocurrency trading. It involves analyzing the average price of an asset, such as Dogecoin (DOGE), over a specified time period to identify trends and potential entry or exit points. Traders often use diff...
See all articles


