-
 Bitcoin
 $107,467.9126
1.26% -
 Ethereum
 $2,447.5288
-0.12% -
 Tether USDt
 $1.0005
0.00% -
 XRP
XRP $2.1921
0.13% -
 BNB
BNB $647.2897
0.50% -
 Solana
 $144.8627
-0.37% -
 USDC
USDC $0.9996
-0.03% -
 TRON
TRON $0.2732
0.10% -
 Dogecoin
 $0.1652
-0.18% -
 Cardano
 $0.5700
-2.87% -
 Hyperliquid
 $37.0274
-1.81% -
 Bitcoin Cash
 $484.6957
0.19% -
 Sui
Sui $2.7354
-2.19% -
 Chainlink
 $13.1727
-1.49% -
 UNUS SED LEO
 $8.9978
-0.04% -
 Stellar
 $0.2421
-2.33% -
 Avalanche
 $17.5633
-3.51% -
 Toncoin
 $2.8476
-1.94% -
 Shiba Inu
 $0.0...01166
-0.56% -
 Litecoin
 $85.1071
0.09% -
 Hedera
 $0.1502
-2.96% -
 Monero
 $310.2774
-1.64% -
 Dai
Dai $0.9999
-0.01% -
 Polkadot
 $3.3584
-1.88% -
 Ethena USDe
 $1.0003
-0.04% -
 Bitget Token
 $4.4443
2.90% -
 Pi
Pi $0.6242
14.04% -
 Uniswap
 $6.9774
-2.86% -
 Pepe
Pepe $0.0...09535
-5.05% -
 Aave
Aave $256.7574
-3.35%
Can the head and shoulders bottom pattern really catch the reversal? How to confirm the neckline breakthrough?
The head and shoulders bottom pattern signals a potential bullish reversal in crypto, confirmed by volume surge and neckline breakout.
Jun 26, 2025 at 10:49 am
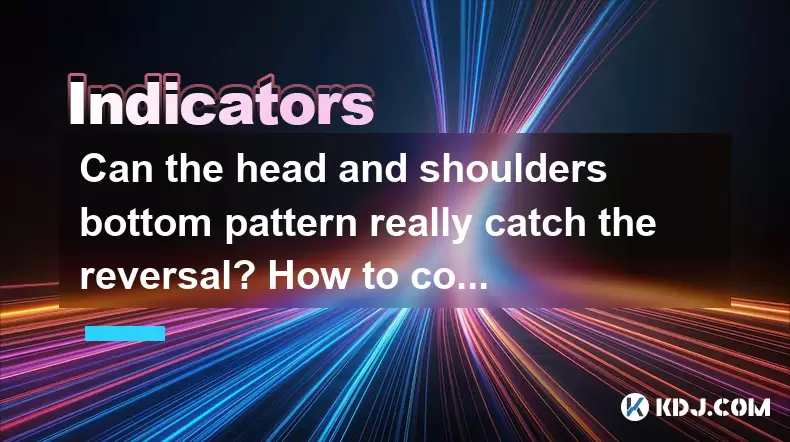
Understanding the Head and Shoulders Bottom Pattern in Cryptocurrency Trading
The head and shoulders bottom pattern, also known as the inverse head and shoulders, is a reversal chart formation commonly used by traders to identify potential bullish reversals in cryptocurrency markets. This pattern typically appears at the end of a downtrend and signals that the selling pressure has weakened and buying momentum may soon take over.
In this setup, there are three distinct lows — the left shoulder, the head (the lowest point), and the right shoulder (which is usually symmetrical with the left). These lows are connected by a horizontal or slightly sloping line called the neckline. The key to interpreting this pattern lies in how price interacts with this neckline.
Important: While this pattern can be highly effective, it should not be relied upon in isolation. It must be confirmed using volume analysis and price action.
How to Identify the Components of the Inverse Head and Shoulders Pattern
To effectively utilize this pattern, traders need to correctly identify its components:
- Left Shoulder: This forms after an extended downtrend and represents a local low.
- Head: A deeper low formed after the left shoulder, indicating stronger bearish momentum.
- Right Shoulder: A higher low than the head, showing that sellers are losing control.
- Neckline: A resistance level drawn connecting the two peaks between the shoulders.
Correct identification of these elements ensures that traders do not misinterpret other similar-looking patterns like double bottoms or triple bottoms.
Critical Tip: Use candlestick confirmation such as bullish engulfing patterns or hammer candles near the right shoulder for added reliability.
Confirming the Neckline Breakout in the Head and Shoulders Bottom Pattern
A breakout above the neckline is considered a strong signal that the trend is reversing from bearish to bullish. However, false breakouts are common in volatile crypto markets, so confirming the validity of the breakout is crucial.
Here’s how to confirm a genuine neckline breakout:
- Volume Surge: A significant increase in trading volume during the breakout indicates strong buyer interest.
- Close Above Neckline: Price must close decisively above the neckline, preferably on a daily or 4-hour chart.
- Retest of the Neckline: After breaking out, the price often retests the neckline as new support. A successful retest confirms the strength of the breakout.
Caution: Avoid entering immediately upon initial touch of the neckline. Wait for a confirmed close above it along with increased volume.
Measuring the Potential Price Target After a Valid Breakout
Once the neckline is broken and confirmed, traders can estimate the minimum price target of the move by measuring the vertical distance from the head to the neckline.
This measured distance is then projected upward from the breakout point. For example, if the head is $100 below the neckline and the breakout occurs at $500, the projected price target would be $600.
It's important to note that this projection serves only as a guideline. Actual price movement can vary due to market sentiment, macroeconomic events, or changes in exchange listings.
Strategy Tip: Place take-profit orders around the projected target zone but remain flexible based on real-time market conditions.
Common Mistakes When Trading the Head and Shoulders Bottom Pattern
Even experienced traders can fall into traps when interpreting this pattern. Here are some frequent errors:
- Premature Entry: Jumping into a trade before the neckline breakout is confirmed.
- Ignoring Volume: Failing to check whether volume supports the breakout.
- Misidentifying the Pattern: Confusing the head and shoulders bottom with other reversal patterns.
- Overlooking Market Context: Applying the pattern in a ranging or sideways market where it’s less reliable.
Avoid These Errors: Always cross-validate with moving averages, RSI, or MACD to filter out weak signals.
Practical Steps to Trade the Head and Shoulders Bottom Pattern
For those looking to implement this strategy in live crypto trading, follow these steps carefully:
- Identify a clear downtrend followed by three distinct lows forming the inverse head and shoulders structure.
- Draw the neckline by connecting the swing highs between the left shoulder and head, and between the head and right shoulder.
- Monitor for a breakout above the neckline with increased volume.
- Wait for a close above the neckline on a time frame suitable for your trading strategy (e.g., 4-hour or daily).
- Enter a long position once the breakout is confirmed, ideally after a retest of the neckline as support.
- Set a stop-loss just below the right shoulder or the head, depending on risk tolerance.
- Calculate the price objective by measuring the distance from the head to the neckline and project it upwards from the breakout point.
Note: Backtesting this pattern on historical charts of major cryptocurrencies like BTC, ETH, or SOL can help validate its effectiveness under different market conditions.
Frequently Asked Questions
Q: Can the head and shoulders bottom pattern appear on any time frame?
Yes, this pattern can occur across multiple time frames including 1-hour, 4-hour, daily, and weekly charts. However, higher time frames offer more reliable signals due to reduced noise and greater liquidity.
Q: What if the right shoulder is higher than the left shoulder?
This is acceptable and even preferable. A higher right shoulder indicates strengthening demand and increases the likelihood of a successful breakout.
Q: Is it necessary to wait for a retest of the neckline before entering a trade?
While not mandatory, waiting for a retest adds confluence and improves the risk-reward ratio. Skipping this step increases the chance of entering on a false breakout.
Q: How does the head and shoulders bottom differ from the double bottom pattern?
The head and shoulders bottom has three lows with the middle one being the deepest, while the double bottom consists of only two equal lows. Additionally, the neckline in a head and shoulders pattern can be slanted, whereas in a double bottom it’s typically horizontal.
Disclaimer:info@kdj.com
The information provided is not trading advice. kdj.com does not assume any responsibility for any investments made based on the information provided in this article. Cryptocurrencies are highly volatile and it is highly recommended that you invest with caution after thorough research!
If you believe that the content used on this website infringes your copyright, please contact us immediately (info@kdj.com) and we will delete it promptly.
- Bitcoin Stagnation & Cooling Metrics: What's Next for BTC?
- 2025-06-26 14:51:53
- Pi Holders, Selling Early, and Pump Timing: What's the Deal?
- 2025-06-26 14:30:13
- Coinbase, Wrapped Tokens, Cardano & Litecoin: A New Era for DeFi?
- 2025-06-26 15:12:18
- Bitcoin, Fed Rate Cut, and the Altcoin Ascent: Navigating ETH, SOL, ADA, and the Meme Coin Mania
- 2025-06-26 14:51:54
- GameStop, Bitcoin, and Funding: A New York Minute on the Latest Moves
- 2025-06-26 15:15:53
- Cardano's Layer-2 Revolution: Unlocking DeFi Potential in the ADA Ecosystem
- 2025-06-26 15:20:16
Related knowledge
Is it necessary to run if the high propeller K line opens low the next day?
Jun 26,2025 at 01:42pm
Understanding the High Propeller K LineA high propeller K line is a candlestick pattern that typically indicates indecision in the market. It features a small real body with long upper and lower shadows, suggesting that both buyers and sellers are active. This pattern often appears during periods of volatility and can signal potential reversals or conti...

Is it a reversal confirmation if the long lower shadow line at a low position opens high the next day?
Jun 26,2025 at 03:08pm
Understanding Candlestick Patterns in Cryptocurrency TradingIn the world of cryptocurrency trading, candlestick patterns are widely used by traders to analyze market sentiment and predict future price movements. These visual representations provide insights into buying and selling pressures at specific price points. One such pattern that often catches t...
In a downward trend, should I stop loss when the volume rebounds to the 10-day line?
Jun 26,2025 at 11:43am
Understanding the 10-Day Volume Line in a Downward TrendIn cryptocurrency trading, volume is one of the most critical indicators for confirming price movements. The 10-day volume line refers to the average volume over the last 10 days and serves as a benchmark for traders to assess whether current volume levels are unusually high or low. When prices are...
Is it a bottom-fishing opportunity if the MACD bottom diverges but the K-line is still falling?
Jun 26,2025 at 12:35pm
Understanding MACD Bottom Divergence in Cryptocurrency TradingIn cryptocurrency trading, MACD (Moving Average Convergence Divergence) bottom divergence is a technical signal that often suggests a potential reversal from a downtrend to an uptrend. This occurs when the price continues to make lower lows, but the MACD indicator forms higher lows. This disc...
Can you recover within three days after falling below the sixty-day line with shrinking volume?
Jun 26,2025 at 01:50pm
Understanding the Sixty-Day Line in Cryptocurrency TradingIn cryptocurrency trading, the sixty-day line is a technical analysis tool used by traders to determine the long-term trend of an asset. It represents the average price of an asset over the last 60 days and acts as a dynamic support or resistance level. When the price of a cryptocurrency falls be...
Should I stop loss when the negative line with reduced volume steps back on the 10-day line?
Jun 26,2025 at 05:42am
Understanding the 10-Day Moving Average in Cryptocurrency TradingIn cryptocurrency trading, the 10-day moving average is a short-term technical indicator used by traders to assess price momentum and potential reversals. It represents the average closing price of an asset over the last 10 days and helps smooth out price volatility. When prices approach o...

Is it necessary to run if the high propeller K line opens low the next day?
Jun 26,2025 at 01:42pm
Understanding the High Propeller K LineA high propeller K line is a candlestick pattern that typically indicates indecision in the market. It features a small real body with long upper and lower shadows, suggesting that both buyers and sellers are active. This pattern often appears during periods of volatility and can signal potential reversals or conti...

Is it a reversal confirmation if the long lower shadow line at a low position opens high the next day?
Jun 26,2025 at 03:08pm
Understanding Candlestick Patterns in Cryptocurrency TradingIn the world of cryptocurrency trading, candlestick patterns are widely used by traders to analyze market sentiment and predict future price movements. These visual representations provide insights into buying and selling pressures at specific price points. One such pattern that often catches t...

In a downward trend, should I stop loss when the volume rebounds to the 10-day line?
Jun 26,2025 at 11:43am
Understanding the 10-Day Volume Line in a Downward TrendIn cryptocurrency trading, volume is one of the most critical indicators for confirming price movements. The 10-day volume line refers to the average volume over the last 10 days and serves as a benchmark for traders to assess whether current volume levels are unusually high or low. When prices are...

Is it a bottom-fishing opportunity if the MACD bottom diverges but the K-line is still falling?
Jun 26,2025 at 12:35pm
Understanding MACD Bottom Divergence in Cryptocurrency TradingIn cryptocurrency trading, MACD (Moving Average Convergence Divergence) bottom divergence is a technical signal that often suggests a potential reversal from a downtrend to an uptrend. This occurs when the price continues to make lower lows, but the MACD indicator forms higher lows. This disc...

Can you recover within three days after falling below the sixty-day line with shrinking volume?
Jun 26,2025 at 01:50pm
Understanding the Sixty-Day Line in Cryptocurrency TradingIn cryptocurrency trading, the sixty-day line is a technical analysis tool used by traders to determine the long-term trend of an asset. It represents the average price of an asset over the last 60 days and acts as a dynamic support or resistance level. When the price of a cryptocurrency falls be...

Should I stop loss when the negative line with reduced volume steps back on the 10-day line?
Jun 26,2025 at 05:42am
Understanding the 10-Day Moving Average in Cryptocurrency TradingIn cryptocurrency trading, the 10-day moving average is a short-term technical indicator used by traders to assess price momentum and potential reversals. It represents the average closing price of an asset over the last 10 days and helps smooth out price volatility. When prices approach o...
See all articles


