-
 Bitcoin
 $117600
0.81% -
 Ethereum
 $3740
2.85% -
 XRP
XRP $3.144
1.82% -
 Tether USDt
 $1.000
-0.02% -
 BNB
BNB $783.9
2.87% -
 Solana
 $186.4
3.29% -
 USDC
USDC $0.0000
0.01% -
 Dogecoin
 $0.2366
4.34% -
 TRON
TRON $0.3171
1.43% -
 Cardano
 $0.8233
3.00% -
 Hyperliquid
 $44.24
6.38% -
 Sui
Sui $3.973
9.32% -
 Stellar
 $0.4373
4.45% -
 Chainlink
 $18.36
4.93% -
 Hedera
 $0.2662
12.25% -
 Bitcoin Cash
 $557.3
6.22% -
 Avalanche
 $24.05
3.14% -
 Litecoin
 $112.8
2.67% -
 UNUS SED LEO
 $8.994
0.20% -
 Shiba Inu
 $0.00001403
5.07% -
 Toncoin
 $3.211
4.17% -
 Ethena USDe
 $1.001
-0.02% -
 Uniswap
 $10.48
6.16% -
 Polkadot
 $4.110
4.03% -
 Monero
 $324.8
-1.64% -
 Dai
Dai $1.000
0.00% -
 Bitget Token
 $4.571
0.92% -
 Pepe
Pepe $0.00001260
5.52% -
 Aave
Aave $297.3
4.47% -
 Cronos
 $0.1321
4.62%
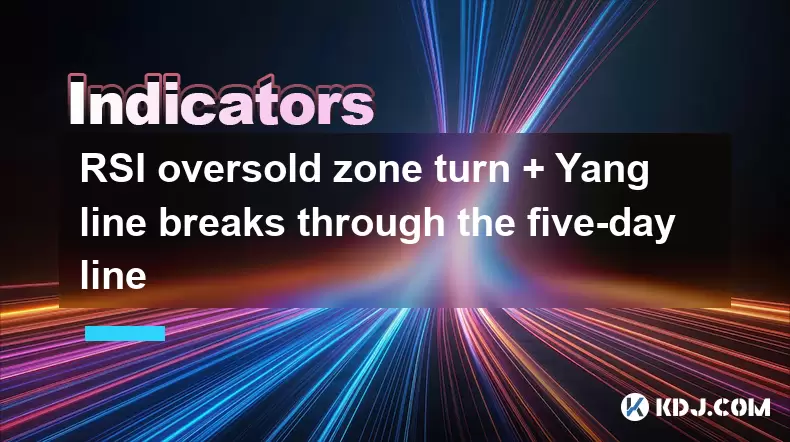
RSI oversold zone turn + Yang line breaks through the five-day line
When RSI drops below 30 and a bullish green candle breaks above the 5-day MA with strong volume, it signals a high-probability reversal in crypto prices.
Jul 25, 2025 at 01:22 pm
Understanding the RSI Oversold Zone in Cryptocurrency Trading
The Relative Strength Index (RSI) is a momentum oscillator widely used in the cryptocurrency market to measure the speed and change of price movements. Typically ranging between 0 and 100, the RSI helps traders identify overbought or oversold conditions. When the RSI falls below 30, it enters the oversold zone, signaling that an asset may be undervalued and due for a potential upward correction. In the volatile crypto market, this signal is particularly significant because rapid price drops often lead to sharp rebounds. However, traders must exercise caution, as an oversold condition does not guarantee an immediate reversal. It only suggests that selling pressure has been intense and may be nearing exhaustion.
For example, during a steep decline in Bitcoin’s price, the RSI might drop to 25, indicating oversold status. This could attract contrarian traders who anticipate a bounce. It's important to monitor volume and broader market sentiment alongside the RSI, as false signals can occur during strong downtrends. The oversold zone should not be used in isolation but as part of a broader technical analysis framework.
What Does a Yang Line Indicate on a Candlestick Chart?
In Japanese candlestick terminology, a Yang line—commonly known as a bullish or green candle—represents a period where the closing price is higher than the opening price. This visual cue indicates buying pressure and positive momentum. A Yang line breaking through the five-day moving average (MA) is a powerful signal, especially when it follows a period of consolidation or downtrend. The five-day MA acts as a short-term trend filter, and a decisive close above it suggests that short-term sentiment is shifting from bearish to bullish.
To identify this pattern:
- Observe a green candle forming after a series of red (bearish) candles.
- Confirm that the closing price of the Yang line is clearly above the value of the five-day MA.
- Ensure that the candle’s body is substantial, not just a small wick, to validate strength.
- Check accompanying volume; higher-than-average volume strengthens the breakout signal.
This combination—Yang line breakout above the five-day MA—is often interpreted as the beginning of a new short-term uptrend, especially when aligned with other bullish indicators.
Combining RSI Oversold Signal with Yang Line Breakout
When the RSI is in the oversold zone and a Yang line breaks above the five-day moving average, it forms a compelling confluence of technical signals. This setup suggests that the selling momentum has likely exhausted, and buyers are stepping in with conviction. Traders look for this alignment to time entries with higher probability.
To confirm this pattern:
- Wait for the RSI to reach or dip below 30.
- Monitor price action for the formation of a bullish candle.
- Verify that this candle closes above the five-day MA.
- Cross-check with volume data—rising volume on the breakout day increases reliability.
- Use support levels or trendlines to further validate the reversal zone.
For instance, if Ethereum drops sharply over three days, pushing RSI to 28, and on the fourth day forms a large green candle closing above its five-day MA with strong volume, this could signal a short-term bottom. Traders might initiate long positions or close short positions based on this setup.
Step-by-Step Guide to Identifying and Acting on This Signal
Traders can follow a structured approach to exploit this technical pattern effectively.
- Open a cryptocurrency trading chart on a platform like TradingView or Binance.
- Apply the RSI indicator with default settings (14 periods).
- Overlay the five-day simple moving average on the price chart.
- Scan for assets where the RSI has recently moved below 30.
- Watch for the next candle to be a Yang (green) candle.
- Confirm that the closing price of this candle is above the five-day MA.
- Check the volume bar—ensure it is higher than the average of the previous three days.
- Place a buy order at the close of the confirming candle or on the next candle’s open.
- Set a stop-loss just below the low of the Yang candle to manage risk.
- Consider taking partial profits when price reaches the next resistance level.
This method helps avoid false signals, such as a weak green candle with low volume that fails to sustain momentum. Discipline in following each step increases the likelihood of successful trades.
Common Pitfalls and How to Avoid Them
Even strong technical setups can fail, especially in the crypto market, which is prone to manipulation and sudden news-driven moves. One common mistake is acting on an RSI oversold signal without confirmation from price action. RSI can remain oversold for extended periods during strong downtrends, leading to premature entries.
Another pitfall is ignoring the broader market context. If Bitcoin is in a strong downtrend, altcoins may struggle to sustain rallies even with bullish signals. Always assess the BTC dominance chart and overall market volume.
Additionally, not using stop-loss orders can result in significant losses if the breakout fails. A breakout above the five-day MA might be followed by a quick reversal, trapping optimistic traders. Setting a clear stop-loss based on recent price structure is essential.
Lastly, overtrading this signal without verifying volume or confluence with support zones can reduce profitability. Patience and selectivity improve long-term results.
FAQs About RSI and Yang Line Breakout Strategy
Q: Can the RSI oversold signal work on timeframes other than daily?
Yes, the RSI oversold signal is applicable across multiple timeframes. On 1-hour or 4-hour charts, RSI below 30 may indicate short-term exhaustion suitable for scalping. However, signals on higher timeframes like daily or weekly carry more weight due to stronger consensus among traders.
Q: What if the Yang line breaks the five-day MA but the RSI is not oversold?
This scenario still indicates short-term bullish momentum, but without the RSI oversold condition, it lacks the contrarian reversal context. It may represent a continuation rather than a reversal pattern. Traders should assess whether the breakout occurs near support or after a pullback to judge its strength.
Q: How long should I hold a position after this signal appears?
There is no fixed duration. Position holding depends on your trading style. Day traders might exit within hours when resistance is approached. Swing traders could hold for days, monitoring for RSI entering overbought territory (above 70) or a close below the five-day MA as exit cues.
Q: Does this strategy work equally well across all cryptocurrencies?
Performance varies. Major coins like Bitcoin and Ethereum tend to exhibit more reliable technical patterns due to higher liquidity. Low-cap altcoins with thin order books may generate false breakouts. Always consider trading volume and market depth before applying this strategy.
Disclaimer:info@kdj.com
The information provided is not trading advice. kdj.com does not assume any responsibility for any investments made based on the information provided in this article. Cryptocurrencies are highly volatile and it is highly recommended that you invest with caution after thorough research!
If you believe that the content used on this website infringes your copyright, please contact us immediately (info@kdj.com) and we will delete it promptly.
- UAE's Digital Asset Revolution: Stablecoin Regulations Take Center Stage
- 2025-07-26 10:40:11
- VIRTUAL Weekly Drop: Recovery Analysis and Privacy Push
- 2025-07-26 08:50:11
- Bitcoin, Cynthia Lummis, and Freedom Money: A New Yorker's Take
- 2025-07-26 08:30:11
- Pudgy Penguins, Crypto Prices, and the Altseason Buzz: What's the Hype?
- 2025-07-26 10:51:48
- Crypto Gainers, Top 10, Week 30: Altcoins Buck the Trend
- 2025-07-26 08:55:12
- Solana, Altcoins, and Coinbase: What's the Buzz?
- 2025-07-26 06:30:12
Related knowledge

What does it mean that the rebound is blocked after the moving average is arranged in a short position for the first time?
Jul 26,2025 at 10:51am
Understanding the Short-Term Moving Average ConfigurationWhen traders refer to a 'short position arrangement' in moving averages, they are describing ...

What does it mean when the price rises along the 5-day moving average for five consecutive days?
Jul 26,2025 at 08:07am
Understanding the 5-Day Moving Average in Cryptocurrency TradingThe 5-day moving average (5DMA) is a widely used technical indicator in cryptocurrency...

What does it mean when the price breaks through the 60-day moving average with a large volume but shrinks the next day?
Jul 26,2025 at 06:01am
Understanding the 60-Day Moving Average in Cryptocurrency TradingThe 60-day moving average (60DMA) is a widely used technical indicator in the cryptoc...
What does it mean when OBV continues to hit new highs but the price is stagnant?
Jul 26,2025 at 09:57am
Understanding the On-Balance Volume (OBV) IndicatorThe On-Balance Volume (OBV) is a technical analysis indicator that uses volume flow to predict chan...
What does the golden cross of EMA12 and EMA26 but the low trading volume reflect?
Jul 26,2025 at 06:44am
Understanding the Golden Cross in EMA12 and EMA26The golden cross is a widely recognized technical indicator in the cryptocurrency market, signaling a...
What does it mean when the price breaks through the 30-day moving average and is accompanied by a large volume?
Jul 26,2025 at 03:35am
Understanding the 30-Day Moving Average in Cryptocurrency TradingThe 30-day moving average (MA) is a widely used technical indicator in the cryptocurr...

What does it mean that the rebound is blocked after the moving average is arranged in a short position for the first time?
Jul 26,2025 at 10:51am
Understanding the Short-Term Moving Average ConfigurationWhen traders refer to a 'short position arrangement' in moving averages, they are describing ...

What does it mean when the price rises along the 5-day moving average for five consecutive days?
Jul 26,2025 at 08:07am
Understanding the 5-Day Moving Average in Cryptocurrency TradingThe 5-day moving average (5DMA) is a widely used technical indicator in cryptocurrency...

What does it mean when the price breaks through the 60-day moving average with a large volume but shrinks the next day?
Jul 26,2025 at 06:01am
Understanding the 60-Day Moving Average in Cryptocurrency TradingThe 60-day moving average (60DMA) is a widely used technical indicator in the cryptoc...

What does it mean when OBV continues to hit new highs but the price is stagnant?
Jul 26,2025 at 09:57am
Understanding the On-Balance Volume (OBV) IndicatorThe On-Balance Volume (OBV) is a technical analysis indicator that uses volume flow to predict chan...

What does the golden cross of EMA12 and EMA26 but the low trading volume reflect?
Jul 26,2025 at 06:44am
Understanding the Golden Cross in EMA12 and EMA26The golden cross is a widely recognized technical indicator in the cryptocurrency market, signaling a...

What does it mean when the price breaks through the 30-day moving average and is accompanied by a large volume?
Jul 26,2025 at 03:35am
Understanding the 30-Day Moving Average in Cryptocurrency TradingThe 30-day moving average (MA) is a widely used technical indicator in the cryptocurr...
See all articles


