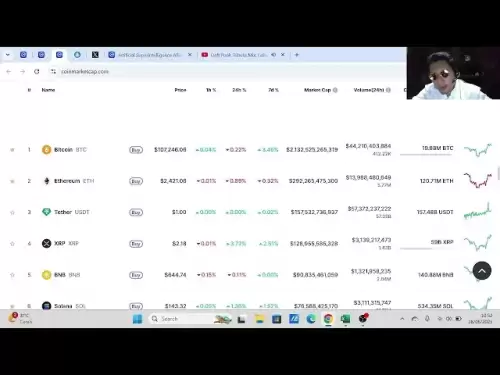
-
 Bitcoin
 $107,461.2530
0.65% -
 Ethereum
 $2,425.6945
-0.64% -
 Tether USDt
 $1.0003
-0.01% -
 XRP
XRP $2.1844
4.49% -
 BNB
BNB $646.3777
0.36% -
 Solana
 $146.6972
3.90% -
 USDC
USDC $1.0000
0.00% -
 TRON
TRON $0.2744
1.17% -
 Dogecoin
 $0.1631
1.28% -
 Cardano
 $0.5609
1.22% -
 Hyperliquid
 $37.0726
2.08% -
 Bitcoin Cash
 $497.3222
-0.12% -
 Sui
Sui $2.7220
3.19% -
 Chainlink
 $13.1487
0.79% -
 UNUS SED LEO
 $9.0787
0.68% -
 Avalanche
 $17.6542
1.11% -
 Stellar
 $0.2377
1.49% -
 Toncoin
 $2.8426
0.81% -
 Shiba Inu
 $0.0...01140
1.72% -
 Litecoin
 $85.2565
0.62% -
 Hedera
 $0.1475
2.69% -
 Monero
 $314.1893
2.28% -
 Bitget Token
 $4.6752
0.90% -
 Dai
Dai $1.0001
0.02% -
 Polkadot
 $3.3425
1.28% -
 Ethena USDe
 $1.0001
0.02% -
 Uniswap
 $6.9500
1.23% -
 Pi
Pi $0.5304
-3.13% -
 Pepe
Pepe $0.0...09311
0.91% -
 Aave
Aave $254.6674
-1.33%
Is it dangerous that the price hits a new high while the MACD red column gradually shortens?
A shortening MACD red column during a price rally signals weakening bearish momentum, potentially indicating trend exhaustion or reversal in crypto markets like Bitcoin or Ethereum.
Jun 28, 2025 at 10:49 am
Understanding the MACD Indicator and Its Components
The Moving Average Convergence Divergence (MACD) is a popular technical analysis tool used by traders to identify potential trend reversals, momentum shifts, and entry or exit points in financial markets, including cryptocurrency. The indicator consists of three main components: the MACD line, the signal line, and the MACD histogram (often referred to as the red column when it appears below the zero line).
When the price of an asset such as Bitcoin or Ethereum reaches a new high while the MACD red column shortens, this may signal a divergence between price movement and momentum. This situation can be concerning for traders who rely on technical signals to make informed decisions.
The MACD red column represents bearish momentum. When it shortens during a price rally, it suggests that selling pressure might be decreasing but not necessarily disappearing.
What Does a Shortening MACD Red Column Mean?
As the price climbs to new highs, one would typically expect the MACD histogram to expand if the bullish momentum is strong and consistent. However, when the histogram bars (the red columns) begin to shrink, it indicates that the strength behind the upward movement is weakening.
This phenomenon can be interpreted as a bearish divergence — a condition where the price continues to rise, but the underlying momentum starts to fade. In the context of cryptocurrency trading, which is known for its volatility and rapid price swings, this could be a warning sign for traders holding long positions.
- Shortening red columns suggest diminishing downward pressure.
- Price reaching new highs with weaker momentum may indicate exhaustion.
- Traders should watch for a possible crossover or histogram flip above zero.
How to Identify and Confirm a Bearish Divergence
Recognizing a bearish divergence requires careful observation of both price action and the MACD histogram. Here’s how to do it step-by-step:
- Identify two consecutive higher highs on the price chart.
- Compare these highs with the corresponding MACD histogram values.
- If the histogram forms lower highs while the price makes higher highs, a divergence exists.
- Use other tools like RSI or volume indicators to confirm the divergence.
In cryptocurrencies like Ethereum or Solana, such patterns often precede sharp corrections due to overbought conditions and profit-taking by institutional players.
Risks Associated with Price Rising Amid Weakening Momentum
When the price hits a new high while the MACD red column shrinks, it may reflect a fragile uptrend. Retail traders might continue buying into the rally, unaware that larger market participants are already reducing exposure.
Some risks include:
- Sudden reversal due to profit-taking by whales or bots.
- Increased likelihood of a candlestick reversal pattern forming.
- False breakout scenarios where the price quickly retraces after hitting resistance levels.
These dynamics are especially relevant in altcoin markets, where liquidity is thinner and manipulation is more common.
Practical Steps to Manage Risk in This Scenario
For traders observing this setup, it's crucial to take defensive measures rather than chasing gains. Here’s what you can do:
- Reduce position size or close partial profits.
- Place a trailing stop-loss just below recent swing lows.
- Monitor volume trends — declining volume amid rising prices supports the bearish case.
- Wait for confirmation of a trend reversal before entering short positions.
By following these steps, traders can protect their capital from abrupt downturns triggered by weak momentum despite rising prices.
Frequently Asked Questions
Can the MACD red column shorten even when the trend remains bullish?
Yes, the red column can temporarily shorten during a healthy bull trend, especially after a consolidation phase. It doesn’t always mean a reversal is imminent unless confirmed by other indicators or price action.
Is this scenario more dangerous in crypto compared to traditional markets?
Cryptocurrency markets are more volatile and prone to manipulation, making momentum-based signals like MACD divergence potentially more impactful. Sudden pump-and-dump schemes or whale movements can exaggerate these setups.
Should I sell immediately when I see this pattern?
Not necessarily. While it’s a cautionary signal, selling should be based on your risk tolerance, strategy, and confirmation from other sources. Consider tightening stops rather than exiting entirely.
Are there any specific coins where this pattern is more reliable?
This pattern tends to be more reliable in major cryptocurrencies like Bitcoin and Ethereum due to higher liquidity and clearer price action. In low-cap altcoins, false signals are more common due to erratic price behavior.
Disclaimer:info@kdj.com
The information provided is not trading advice. kdj.com does not assume any responsibility for any investments made based on the information provided in this article. Cryptocurrencies are highly volatile and it is highly recommended that you invest with caution after thorough research!
If you believe that the content used on this website infringes your copyright, please contact us immediately (info@kdj.com) and we will delete it promptly.
- Across Crypto Project Faces Heat: Secret $23M Transfer Sparks Governance Debate
- 2025-06-28 16:30:13
- Trump Coin's Wild Ride: Liquidity Drain, Exchange Deposits, and What It Means for Binance & OKX
- 2025-06-28 16:50:13
- Trump, Memecoin Mania, and Whale Watching: A New York Minute in Crypto
- 2025-06-28 16:30:13
- Shiba Inu, Lending Coins, and Early Holders: A New Frontier
- 2025-06-28 16:51:59
- Meme Coins in July 2025: Investing in the Future of Hype?
- 2025-06-28 16:51:59
- SUI's Trending Surge: Decoding the Reasons Behind the Hype
- 2025-06-28 16:55:12
Related knowledge
Should I go if the average price line of the time-sharing chart suppresses the rebound?
Jun 28,2025 at 05:14pm
Understanding the Time-Sharing Chart and Average Price LineThe time-sharing chart is a real-time chart used in cryptocurrency trading to visualize price movements over short intervals, typically within a single trading day. It provides traders with insights into intraday volatility and momentum. The average price line, often calculated as a moving avera...
Can I add positions after the EXPMA golden cross steps back on the yellow line?
Jun 28,2025 at 11:57am
Understanding the EXPMA Indicator and Its RelevanceThe EXPMA (Exponential Moving Average) is a technical analysis tool used by traders to identify trends and potential entry or exit points in financial markets, including cryptocurrency trading. Unlike simple moving averages, EXPMA gives more weight to recent price data, making it more responsive to new ...
How to operate the next day after the daily limit is released with huge volume?
Jun 28,2025 at 12:35pm
Understanding the Daily Limit and Its ReleaseIn cryptocurrency trading, daily limits are often set by exchanges to manage volatility or during periods of high market activity. These limits can restrict how much an asset's price can fluctuate within a 24-hour period. When the daily limit is released, it typically means that the price cap has been lifted,...
Is it necessary to stop loss when the lower track of the rising channel falls below?
Jun 28,2025 at 05:29pm
Understanding the Rising Channel PatternThe rising channel pattern is a popular technical analysis tool used by traders to identify potential upward trends in asset prices. It consists of two parallel lines: an upper resistance line and a lower support line, both sloping upwards. The price action typically oscillates between these boundaries, offering o...
Can I chase after the W bottom neckline breaks through with large volume?
Jun 28,2025 at 07:28am
Understanding the W Bottom Pattern in Cryptocurrency TradingThe W bottom pattern is a common technical analysis formation used by traders to identify potential bullish reversals. In cryptocurrency markets, this pattern typically appears after a downtrend and signals that the selling pressure may be diminishing. The structure of the W bottom includes two...
Is it effective if the gap is not filled for three days?
Jun 28,2025 at 01:00pm
Understanding Gaps in Cryptocurrency MarketsIn the context of cryptocurrency trading, a gap refers to a situation where the price of an asset opens significantly higher or lower than its previous closing price, with no trading activity occurring in between. These gaps are commonly observed during periods of high volatility, especially when major news ev...

Should I go if the average price line of the time-sharing chart suppresses the rebound?
Jun 28,2025 at 05:14pm
Understanding the Time-Sharing Chart and Average Price LineThe time-sharing chart is a real-time chart used in cryptocurrency trading to visualize price movements over short intervals, typically within a single trading day. It provides traders with insights into intraday volatility and momentum. The average price line, often calculated as a moving avera...

Can I add positions after the EXPMA golden cross steps back on the yellow line?
Jun 28,2025 at 11:57am
Understanding the EXPMA Indicator and Its RelevanceThe EXPMA (Exponential Moving Average) is a technical analysis tool used by traders to identify trends and potential entry or exit points in financial markets, including cryptocurrency trading. Unlike simple moving averages, EXPMA gives more weight to recent price data, making it more responsive to new ...

How to operate the next day after the daily limit is released with huge volume?
Jun 28,2025 at 12:35pm
Understanding the Daily Limit and Its ReleaseIn cryptocurrency trading, daily limits are often set by exchanges to manage volatility or during periods of high market activity. These limits can restrict how much an asset's price can fluctuate within a 24-hour period. When the daily limit is released, it typically means that the price cap has been lifted,...

Is it necessary to stop loss when the lower track of the rising channel falls below?
Jun 28,2025 at 05:29pm
Understanding the Rising Channel PatternThe rising channel pattern is a popular technical analysis tool used by traders to identify potential upward trends in asset prices. It consists of two parallel lines: an upper resistance line and a lower support line, both sloping upwards. The price action typically oscillates between these boundaries, offering o...

Can I chase after the W bottom neckline breaks through with large volume?
Jun 28,2025 at 07:28am
Understanding the W Bottom Pattern in Cryptocurrency TradingThe W bottom pattern is a common technical analysis formation used by traders to identify potential bullish reversals. In cryptocurrency markets, this pattern typically appears after a downtrend and signals that the selling pressure may be diminishing. The structure of the W bottom includes two...

Is it effective if the gap is not filled for three days?
Jun 28,2025 at 01:00pm
Understanding Gaps in Cryptocurrency MarketsIn the context of cryptocurrency trading, a gap refers to a situation where the price of an asset opens significantly higher or lower than its previous closing price, with no trading activity occurring in between. These gaps are commonly observed during periods of high volatility, especially when major news ev...
See all articles


