-
 Bitcoin
 $102,838.3669
-0.64% -
 Ethereum
 $2,288.9548
-5.70% -
 Tether USDt
 $1.0003
0.01% -
 XRP
XRP $2.0782
-2.11% -
 BNB
BNB $632.3292
-1.65% -
 Solana
 $136.1959
-2.98% -
 USDC
USDC $1.0000
0.01% -
 TRON
TRON $0.2726
-0.11% -
 Dogecoin
 $0.1566
-4.06% -
 Cardano
 $0.5552
-5.18% -
 Hyperliquid
 $34.2720
-1.05% -
 Bitcoin Cash
 $466.8638
-1.20% -
 Sui
Sui $2.5776
-5.75% -
 UNUS SED LEO
 $8.9685
0.02% -
 Chainlink
 $12.0304
-5.11% -
 Stellar
 $0.2375
-2.47% -
 Avalanche
 $16.9243
-3.74% -
 Toncoin
 $2.8539
-2.82% -
 Shiba Inu
 $0.0...01091
-4.04% -
 Litecoin
 $81.4197
-2.58% -
 Hedera
 $0.1374
-5.25% -
 Monero
 $310.1410
-1.30% -
 Ethena USDe
 $1.0006
0.01% -
 Dai
Dai $1.0000
0.00% -
 Polkadot
 $3.2843
-5.48% -
 Bitget Token
 $4.2110
-1.76% -
 Uniswap
 $6.4977
-7.96% -
 Pepe
Pepe $0.0...09321
-7.31% -
 Pi
Pi $0.5074
-6.27% -
 Aave
Aave $234.8342
-5.61%
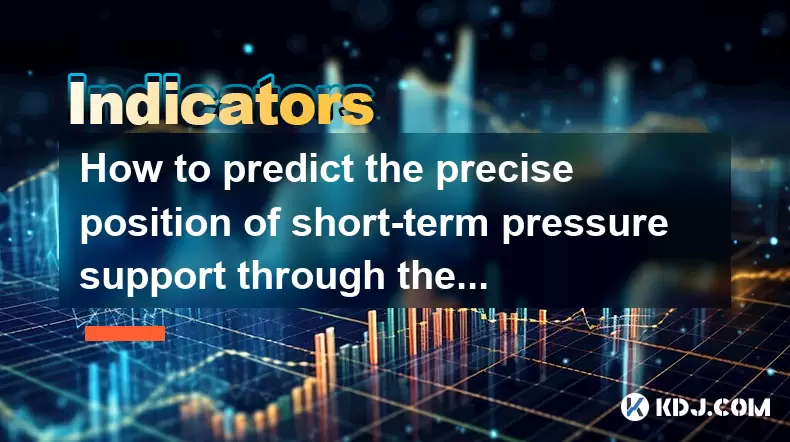
How to predict the precise position of short-term pressure support through the order data?
Order data analysis helps predict short-term pressure and support in crypto trading by identifying clusters and volumes in the order book, enhancing trading decisions.
Jun 12, 2025 at 10:49 pm
Understanding Short-term Pressure and Support in Cryptocurrency Trading
In the world of cryptocurrency trading, short-term pressure and support levels are crucial for traders looking to make quick and profitable decisions. These levels represent the points at which the price of a cryptocurrency is likely to encounter resistance (pressure) or find a base (support). Predicting these levels accurately can significantly enhance a trader's ability to buy low and sell high. One effective method to predict these levels is through the analysis of order data, which provides insights into the buying and selling intentions of other market participants.
What is Order Data?
Order data refers to the information about the buy and sell orders placed on a cryptocurrency exchange. This data includes the number of orders at various price levels, the volume of these orders, and other related metrics. By examining order data, traders can gain a clearer picture of where significant buying or selling pressure might emerge, thus helping to predict short-term pressure and support levels.
Collecting and Analyzing Order Data
To begin predicting short-term pressure and support levels, traders need to collect and analyze order data from their chosen cryptocurrency exchange. Here's how to do it:
- Access the Order Book: Most cryptocurrency exchanges provide an order book that displays all current buy and sell orders. This can usually be found within the trading interface of the exchange.
- Export the Data: Some exchanges allow you to export the order book data in a format like CSV. If this option is available, use it to get a more detailed analysis.
- Use Trading Tools: Various trading platforms and tools can help automate the process of collecting and analyzing order data. Tools like TradingView or custom-built scripts in Python can be particularly useful.
Identifying Key Levels from Order Data
Once the order data is collected, the next step is to identify the key levels that could act as short-term pressure or support. Here’s how to do it:
- Look for Clusters: Clusters of orders at specific price points can indicate potential pressure or support levels. A large number of buy orders at a particular price suggests strong support, while a cluster of sell orders indicates potential resistance.
- Analyze Order Volume: The volume of orders at different price levels is another crucial factor. Higher volumes indicate stronger potential for the price to react at those levels.
- Check the Bid-Ask Spread: The bid-ask spread can also provide clues. A narrow spread might suggest a strong and immediate reaction at a particular price level, while a wider spread could indicate less immediate pressure.
Practical Example: Using Order Data to Predict Short-term Levels
Let's walk through a practical example to illustrate how to use order data to predict short-term pressure and support levels. Suppose you are trading Bitcoin on a popular exchange and you want to predict where the price might face resistance or find support in the next few hours.
- Step 1: Access the Order Book: Open the trading interface on your chosen exchange and locate the order book section.
- Step 2: Identify Clusters: Scroll through the order book and note any significant clusters of buy and sell orders. For example, you might see a large number of buy orders at $30,000 and a significant number of sell orders at $30,500.
- Step 3: Analyze Order Volume: Check the volume of orders at these clustered levels. If there are 1,000 buy orders at $30,000 and 800 sell orders at $30,500, these levels become even more significant.
- Step 4: Consider the Bid-Ask Spread: Look at the bid-ask spread around these levels. If the spread is narrow at $30,000 and wider at $30,500, it suggests that $30,000 might act as a strong support level, while $30,500 could be a resistance level.
- Step 5: Make Predictions: Based on this analysis, you can predict that Bitcoin might find strong support at $30,000 and face resistance at $30,500 in the short term.
Using Technical Indicators to Complement Order Data
While order data provides valuable insights, combining it with technical indicators can enhance the accuracy of your predictions. Here are some indicators that can be used alongside order data:
- Moving Averages: Moving averages can help confirm potential support and resistance levels identified through order data.
- Relative Strength Index (RSI): The RSI can indicate whether a cryptocurrency is overbought or oversold, which can influence the effectiveness of identified support and resistance levels.
- Bollinger Bands: Bollinger Bands can highlight potential volatility and price movements around key levels identified from order data.
Monitoring and Adjusting Predictions
Predicting short-term pressure and support levels is an ongoing process. As market conditions change, so too will the order data. Therefore, it's essential to:
- Monitor the Order Book: Continuously check the order book for any new clusters or changes in volume that might affect your predictions.
- Adjust Your Analysis: Be prepared to adjust your predictions based on new data and market developments.
- Combine with Other Data: Use other market data and news to validate your predictions based on order data.
FAQs
Q1: Can order data be manipulated by large traders to mislead others?
A1: Yes, large traders can sometimes place large orders at specific price levels to create false impressions of support or resistance. This practice is known as "spoofing." It's important to be aware of this possibility and use other indicators to validate your findings from order data.
Q2: How often should I update my order data analysis?
A2: It depends on your trading strategy and the volatility of the market. For short-term trading, updating your analysis every few hours or even more frequently can be beneficial. For less volatile markets, daily updates might suffice.
Q3: Is order data analysis suitable for all types of cryptocurrencies?
A3: Order data analysis can be applied to any cryptocurrency traded on an exchange that provides an order book. However, the effectiveness might vary depending on the liquidity and trading volume of the specific cryptocurrency.
Q4: Can I use order data analysis for long-term trading?
A4: While order data is particularly useful for short-term trading, it can also be used to inform long-term trading decisions. However, for long-term predictions, it's crucial to combine order data with broader market analysis and fundamental factors.
Disclaimer:info@kdj.com
The information provided is not trading advice. kdj.com does not assume any responsibility for any investments made based on the information provided in this article. Cryptocurrencies are highly volatile and it is highly recommended that you invest with caution after thorough research!
If you believe that the content used on this website infringes your copyright, please contact us immediately (info@kdj.com) and we will delete it promptly.
- Bitcoin in Europe: France's Budding Romance with BTC
- 2025-06-22 12:45:12
- BNB Chain Altcoin Meltdown: Navigating the Storm and Spotting Opportunities
- 2025-06-22 12:45:12
- Inherited Riches: Rare Coin Collection Valued at £6,000 – Is Your Change Worth a Fortune?
- 2025-06-22 12:25:12
- Fiat-Backed Stablecoins, Tokenized Treasuries, and DeFi: A New York Minute on the Future of Finance
- 2025-06-22 12:25:12
- Pumpfun Token Launch Faces Crypto Backlash: A Billion-Dollar Gamble?
- 2025-06-22 12:50:12
- Pepe Coin Price Prediction: Crash Risk and What's Next for Frog-Themed Crypto
- 2025-06-22 13:05:13
Related knowledge
Does the second surge in the RSI overbought zone induce more?
Jun 22,2025 at 08:35am
Understanding the RSI Overbought ZoneThe Relative Strength Index (RSI) is a momentum oscillator commonly used in technical analysis to measure the speed and change of price movements. It ranges from 0 to 100, with values above 70 typically considered overbought and values below 30 considered oversold. When the RSI enters the overbought zone for the firs...
Does the sudden contraction of ATR indicate the end of the trend?
Jun 20,2025 at 11:14pm
Understanding ATR and Its Role in Technical AnalysisThe Average True Range (ATR) is a technical indicator used to measure market volatility. Developed by J. Welles Wilder, ATR calculates the average range of price movement over a specified period, typically 14 periods. It does not indicate direction—only volatility. Traders use ATR to gauge how much an ...
Is it invalid if the DMI crosses but the ADX does not expand?
Jun 21,2025 at 09:35am
Understanding the DMI and ADX RelationshipIn technical analysis, the Directional Movement Index (DMI) consists of two lines: +DI (Positive Directional Indicator) and -DI (Negative Directional Indicator). These indicators are used to determine the direction of a trend. When +DI crosses above -DI, it is often interpreted as a bullish signal, while the opp...
How to filter false signals when the SAR indicator frequently flips?
Jun 21,2025 at 08:43pm
Understanding the SAR Indicator and Its BehaviorThe SAR (Stop and Reverse) indicator is a popular technical analysis tool used in cryptocurrency trading to identify potential reversals in price movement. It appears as a series of dots placed either above or below the price chart, signaling bullish or bearish trends. When the dots are below the price, it...
Is the trend continuation when the Williams indicator is oversold but there is no rebound?
Jun 20,2025 at 11:42pm
Understanding the Williams %R IndicatorThe Williams %R indicator, also known as the Williams Percent Range, is a momentum oscillator used in technical analysis to identify overbought and oversold levels in price movements. It typically ranges from 0 to -100, where values above -20 are considered overbought and values below -80 are considered oversold. T...
Is the shrinking volume after the moving average golden cross invalid?
Jun 22,2025 at 10:42am
Understanding the Moving Average Golden Cross in CryptocurrencyIn the world of cryptocurrency trading, technical indicators play a crucial role in decision-making. One such indicator is the moving average golden cross, which occurs when a short-term moving average crosses above a long-term moving average, typically signaling a bullish trend. This event ...

Does the second surge in the RSI overbought zone induce more?
Jun 22,2025 at 08:35am
Understanding the RSI Overbought ZoneThe Relative Strength Index (RSI) is a momentum oscillator commonly used in technical analysis to measure the speed and change of price movements. It ranges from 0 to 100, with values above 70 typically considered overbought and values below 30 considered oversold. When the RSI enters the overbought zone for the firs...

Does the sudden contraction of ATR indicate the end of the trend?
Jun 20,2025 at 11:14pm
Understanding ATR and Its Role in Technical AnalysisThe Average True Range (ATR) is a technical indicator used to measure market volatility. Developed by J. Welles Wilder, ATR calculates the average range of price movement over a specified period, typically 14 periods. It does not indicate direction—only volatility. Traders use ATR to gauge how much an ...

Is it invalid if the DMI crosses but the ADX does not expand?
Jun 21,2025 at 09:35am
Understanding the DMI and ADX RelationshipIn technical analysis, the Directional Movement Index (DMI) consists of two lines: +DI (Positive Directional Indicator) and -DI (Negative Directional Indicator). These indicators are used to determine the direction of a trend. When +DI crosses above -DI, it is often interpreted as a bullish signal, while the opp...

How to filter false signals when the SAR indicator frequently flips?
Jun 21,2025 at 08:43pm
Understanding the SAR Indicator and Its BehaviorThe SAR (Stop and Reverse) indicator is a popular technical analysis tool used in cryptocurrency trading to identify potential reversals in price movement. It appears as a series of dots placed either above or below the price chart, signaling bullish or bearish trends. When the dots are below the price, it...

Is the trend continuation when the Williams indicator is oversold but there is no rebound?
Jun 20,2025 at 11:42pm
Understanding the Williams %R IndicatorThe Williams %R indicator, also known as the Williams Percent Range, is a momentum oscillator used in technical analysis to identify overbought and oversold levels in price movements. It typically ranges from 0 to -100, where values above -20 are considered overbought and values below -80 are considered oversold. T...

Is the shrinking volume after the moving average golden cross invalid?
Jun 22,2025 at 10:42am
Understanding the Moving Average Golden Cross in CryptocurrencyIn the world of cryptocurrency trading, technical indicators play a crucial role in decision-making. One such indicator is the moving average golden cross, which occurs when a short-term moving average crosses above a long-term moving average, typically signaling a bullish trend. This event ...
See all articles


