-
 Bitcoin
 $107,467.9126
1.26% -
 Ethereum
 $2,447.5288
-0.12% -
 Tether USDt
 $1.0005
0.00% -
 XRP
XRP $2.1921
0.13% -
 BNB
BNB $647.2897
0.50% -
 Solana
 $144.8627
-0.37% -
 USDC
USDC $0.9996
-0.03% -
 TRON
TRON $0.2732
0.10% -
 Dogecoin
 $0.1652
-0.18% -
 Cardano
 $0.5700
-2.87% -
 Hyperliquid
 $37.0274
-1.81% -
 Bitcoin Cash
 $484.6957
0.19% -
 Sui
Sui $2.7354
-2.19% -
 Chainlink
 $13.1727
-1.49% -
 UNUS SED LEO
 $8.9978
-0.04% -
 Stellar
 $0.2421
-2.33% -
 Avalanche
 $17.5633
-3.51% -
 Toncoin
 $2.8476
-1.94% -
 Shiba Inu
 $0.0...01166
-0.56% -
 Litecoin
 $85.1071
0.09% -
 Hedera
 $0.1502
-2.96% -
 Monero
 $310.2774
-1.64% -
 Dai
Dai $0.9999
-0.01% -
 Polkadot
 $3.3584
-1.88% -
 Ethena USDe
 $1.0003
-0.04% -
 Bitget Token
 $4.4443
2.90% -
 Pi
Pi $0.6242
14.04% -
 Uniswap
 $6.9774
-2.86% -
 Pepe
Pepe $0.0...09535
-5.05% -
 Aave
Aave $256.7574
-3.35%
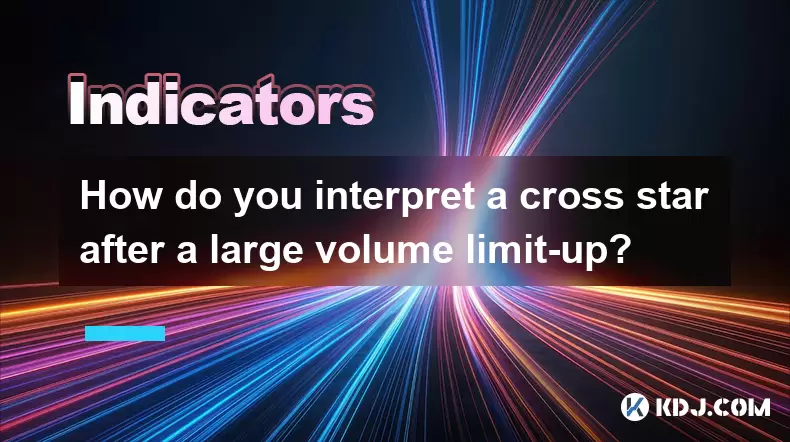
How do you interpret a cross star after a large volume limit-up?
A cross star following a large volume limit-up in crypto signals market indecision, hinting at possible trend reversal or consolidation.
Jun 25, 2025 at 11:01 pm
Understanding the Cross Star Pattern in Cryptocurrency Charts
In cryptocurrency trading, candlestick patterns play a crucial role in technical analysis. One such pattern is the cross star, which typically appears as a candle with small real body and long upper and lower shadows. This pattern often signals market indecision and can indicate a potential reversal or consolidation phase.
When this pattern emerges after a large volume limit-up movement — where an asset's price rises sharply to its maximum allowable increase in a short time — it becomes especially significant. Traders need to interpret this combination carefully, as it may suggest that the upward momentum is weakening or that profit-taking is occurring.
What Does a Limit-Up Mean in Crypto Trading?
A limit-up in crypto refers to a sharp upward move in price that reaches the maximum daily percentage gain allowed by exchanges or observed through natural market behavior. Although unlike traditional markets, most crypto exchanges do not impose circuit breakers, traders often use the term colloquially to describe sudden explosive moves driven by strong buying pressure.
This kind of movement usually happens during high volatility periods, often triggered by positive news, whale buying, or broader market sentiment shifts. When a digital asset experiences a large volume limit-up, it means that not only did the price surge significantly, but it was also accompanied by unusually high trading volume, indicating strong participation from both retail and institutional investors.
Significance of High Volume During a Limit-Up Move
Volume plays a critical role in validating price movements. A high volume limit-up suggests that the rally is supported by strong market conviction. However, when a cross star follows this type of move, it introduces uncertainty into the picture.
The key takeaway here is that while high volume during the limit-up confirms strength, the appearance of a cross star afterward shows that neither bulls nor bears are able to take control. This equilibrium often precedes either a continuation of the trend if buyers regain confidence or a pullback if sellers begin to dominate.
Analyzing the Cross Star After a Bull Run
Following a large volume limit-up, the emergence of a cross star can be interpreted as a warning sign for traders who are long on the asset. It indicates hesitation in the market and could mean that:
- Profit-taking is beginning among early buyers.
- Resistance levels are being tested.
- New traders are entering at highs but facing pushback.
- The uptrend might pause or reverse temporarily.
It’s important to note that the cross star alone is not enough to conclude a trend reversal. Traders should look for confirmation candles in the following sessions to determine whether the bullish momentum is truly fading or if the market is merely consolidating before another push higher.
How to Approach Trading After Observing This Pattern
For traders monitoring charts, spotting a cross star after a large volume limit-up requires careful strategy development. Here are some steps to consider:
- Wait for confirmation: Do not act immediately upon seeing the cross star. Observe the next 1–2 candles to see if a bearish pattern forms or if the price resumes its upward trajectory.
- Check support and resistance levels: If the cross star appears near a known resistance zone, it increases the likelihood of a pullback.
- Monitor volume trends: If volume drops significantly after the limit-up, it may indicate waning interest. Conversely, sustained or rising volume could signal accumulation.
- Set stop-loss orders: For those holding long positions, placing a stop-loss just below the low of the cross star candle can help manage risk.
- Use other indicators: Combine candlestick analysis with tools like RSI, MACD, or moving averages to strengthen your decision-making process.
Potential Misinterpretations and Common Mistakes
Traders sometimes misread the cross star as a definitive reversal signal without considering the broader context. In fast-moving crypto markets, false signals are common. Some frequent mistakes include:
- Acting solely based on the candlestick without factoring in overall market conditions.
- Ignoring the time frame: A cross star on a 1-hour chart may not carry the same weight as one on a daily chart.
- Overlooking news events or macroeconomic factors that could influence price action beyond technical signals.
- Failing to adjust strategies based on liquidity changes or exchange-specific behaviors.
Avoiding these pitfalls involves combining technical insights with fundamental understanding and maintaining disciplined risk management practices.
Frequently Asked Questions (FAQ)
Q: Can a cross star appear during downtrends as well?
Yes, a cross star can appear in any market condition. In a downtrend, it may signal exhaustion among sellers or a potential bounce. However, interpretation still depends on volume and surrounding price action.
Q: Is the cross star more reliable on certain cryptocurrencies?
No single candlestick pattern is universally more reliable on specific assets. Its effectiveness depends on market structure, liquidity, and how it aligns with other indicators across different coins or tokens.
Q: How long should I wait after seeing a cross star before making a trade decision?
Typically, waiting for the next 1–2 candlesticks provides clearer direction. Patience helps avoid premature decisions based on incomplete data.
Q: Are there variations of the cross star candle?
Yes, variations include the doji, dragonfly doji, and gravestone doji, each conveying slightly different market psychology depending on their shape and placement within the trend.
Disclaimer:info@kdj.com
The information provided is not trading advice. kdj.com does not assume any responsibility for any investments made based on the information provided in this article. Cryptocurrencies are highly volatile and it is highly recommended that you invest with caution after thorough research!
If you believe that the content used on this website infringes your copyright, please contact us immediately (info@kdj.com) and we will delete it promptly.
- Missiles, Iran, and Crypto Presales: Navigating a Complex Landscape
- 2025-06-26 16:05:12
- Bitcoin Stagnation & Cooling Metrics: What's Next for BTC?
- 2025-06-26 14:51:53
- XRP, UAE, and Crypto Payments: A New Yorker's Take on Taxis and Tokenization
- 2025-06-26 16:05:12
- Ruvi AI: The Utility Token Poised to Eclipse Ripple's Legacy?
- 2025-06-26 16:10:14
- Pi Holders, Selling Early, and Pump Timing: What's the Deal?
- 2025-06-26 14:30:13
- Coinbase, Wrapped Tokens, Cardano & Litecoin: A New Era for DeFi?
- 2025-06-26 15:12:18
Related knowledge
Will the time-sharing chart open higher the next day after the end of the trading?
Jun 26,2025 at 04:35pm
Understanding Time-Sharing Charts in Cryptocurrency TradingIn the realm of cryptocurrency trading, time-sharing charts, often referred to as tick or intraday charts, play a crucial role in analyzing short-term price movements. These charts display price fluctuations over very small time intervals, such as 1 minute, 5 minutes, or 15 minutes. Traders rely...
Can I chase it if the continuous small positive lines push it up but the increase is limited?
Jun 26,2025 at 03:42pm
Understanding the Concept of Continuous Small Positive LinesIn the realm of cryptocurrency trading, continuous small positive lines refer to a pattern where an asset's price consistently rises in small increments over a period. These movements are typically observed on candlestick charts and can indicate underlying strength or accumulation by larger pla...
Is it necessary to run if the high propeller K line opens low the next day?
Jun 26,2025 at 01:42pm
Understanding the High Propeller K LineA high propeller K line is a candlestick pattern that typically indicates indecision in the market. It features a small real body with long upper and lower shadows, suggesting that both buyers and sellers are active. This pattern often appears during periods of volatility and can signal potential reversals or conti...

Is it a reversal confirmation if the long lower shadow line at a low position opens high the next day?
Jun 26,2025 at 03:08pm
Understanding Candlestick Patterns in Cryptocurrency TradingIn the world of cryptocurrency trading, candlestick patterns are widely used by traders to analyze market sentiment and predict future price movements. These visual representations provide insights into buying and selling pressures at specific price points. One such pattern that often catches t...
In a downward trend, should I stop loss when the volume rebounds to the 10-day line?
Jun 26,2025 at 11:43am
Understanding the 10-Day Volume Line in a Downward TrendIn cryptocurrency trading, volume is one of the most critical indicators for confirming price movements. The 10-day volume line refers to the average volume over the last 10 days and serves as a benchmark for traders to assess whether current volume levels are unusually high or low. When prices are...
Is it a bottom-fishing opportunity if the MACD bottom diverges but the K-line is still falling?
Jun 26,2025 at 12:35pm
Understanding MACD Bottom Divergence in Cryptocurrency TradingIn cryptocurrency trading, MACD (Moving Average Convergence Divergence) bottom divergence is a technical signal that often suggests a potential reversal from a downtrend to an uptrend. This occurs when the price continues to make lower lows, but the MACD indicator forms higher lows. This disc...

Will the time-sharing chart open higher the next day after the end of the trading?
Jun 26,2025 at 04:35pm
Understanding Time-Sharing Charts in Cryptocurrency TradingIn the realm of cryptocurrency trading, time-sharing charts, often referred to as tick or intraday charts, play a crucial role in analyzing short-term price movements. These charts display price fluctuations over very small time intervals, such as 1 minute, 5 minutes, or 15 minutes. Traders rely...

Can I chase it if the continuous small positive lines push it up but the increase is limited?
Jun 26,2025 at 03:42pm
Understanding the Concept of Continuous Small Positive LinesIn the realm of cryptocurrency trading, continuous small positive lines refer to a pattern where an asset's price consistently rises in small increments over a period. These movements are typically observed on candlestick charts and can indicate underlying strength or accumulation by larger pla...

Is it necessary to run if the high propeller K line opens low the next day?
Jun 26,2025 at 01:42pm
Understanding the High Propeller K LineA high propeller K line is a candlestick pattern that typically indicates indecision in the market. It features a small real body with long upper and lower shadows, suggesting that both buyers and sellers are active. This pattern often appears during periods of volatility and can signal potential reversals or conti...

Is it a reversal confirmation if the long lower shadow line at a low position opens high the next day?
Jun 26,2025 at 03:08pm
Understanding Candlestick Patterns in Cryptocurrency TradingIn the world of cryptocurrency trading, candlestick patterns are widely used by traders to analyze market sentiment and predict future price movements. These visual representations provide insights into buying and selling pressures at specific price points. One such pattern that often catches t...

In a downward trend, should I stop loss when the volume rebounds to the 10-day line?
Jun 26,2025 at 11:43am
Understanding the 10-Day Volume Line in a Downward TrendIn cryptocurrency trading, volume is one of the most critical indicators for confirming price movements. The 10-day volume line refers to the average volume over the last 10 days and serves as a benchmark for traders to assess whether current volume levels are unusually high or low. When prices are...

Is it a bottom-fishing opportunity if the MACD bottom diverges but the K-line is still falling?
Jun 26,2025 at 12:35pm
Understanding MACD Bottom Divergence in Cryptocurrency TradingIn cryptocurrency trading, MACD (Moving Average Convergence Divergence) bottom divergence is a technical signal that often suggests a potential reversal from a downtrend to an uptrend. This occurs when the price continues to make lower lows, but the MACD indicator forms higher lows. This disc...
See all articles


