Discover Cryptocurrencies With Potential
Discover cryptocurrencies with potential, let us become richer together and add a zero to the end of our assets.
| Name | Price Price by day (USD). | Change%(7d) Price change by selected time range. | Volume(24h) Aggregated daily volume, measured in USD from on-chain transactions where each transaction was greater than $100,000. | Market Cap The total value of all the circulating supply of a cryptocurrency. It’s calculated by multiplying the current market price by the total number of coins that are currently in circulation. | Circulating supply The amount of coins that are circulating in the market and are in public hands. It is analogous to the flowing shares in the stock market. | Ownership Distribution Shows the circulating supply distribution of a cryptocurrency. The three groups are classified such as: Whales: Addresses holding over 1% of a crypto-asset’s circulating supply. Investors:Addresses holding between 0.1% and 1% of circulating supply. Retail: Addresses with less than 0.1% of circulating supply. | Telegram Sentiment Uses a classification machine learning technique to determine if the texts used in the Telegram messages related to a given token have a positive, negative,orneutral connotation. | |
|---|---|---|---|---|---|---|---|---|
| $0.0...02881 $0.0000 | -4.30% | -- | $12.12K | 42069T Self Reported Circulating Supply42069T Self Reported Max Supply42069T | ||||
| $0.0...02417 $0.0000 | -4.30% | -- | $101.68K | 420.69B Self Reported Circulating Supply420.69B Self Reported Max Supply420.69B | ||||
| $0.2659 $0.2659 | -4.29% | $9.93K | $18.45M | 69.4M Self Reported Circulating Supply69.4M Self Reported Max Supply73.74M | ||||
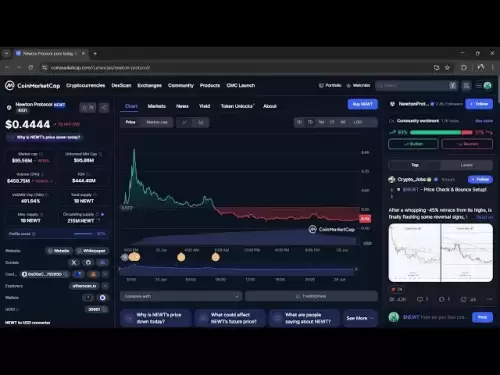
| $0.4494 $0.4494 | -4.29% | $4.06K | $4.49M | 10M Percentage100.00% Circulating supply10M Maximum Supply10M |
|
| ||
| $0.0...01687 $0.0000 | -4.29% | -- | $788.17K | 467.17T Self Reported Circulating Supply467.17T Self Reported Max Supply467.17T | ||||
| $0.0...07342 $0.0000 | -4.29% | $825 | $1.56M | 21.31T Self Reported Circulating Supply21.31T Self Reported Max Supply21.31T | ||||
| $0.0...06302 $0.0006 | -4.29% | $74.36K | $1.05M | 1.66B | ||||
| $0.0...03987 $0.0000 | -4.29% | -- | $39.88K | 1B Self Reported Circulating Supply1B Self Reported Max Supply1B | ||||
| $0.0093 $0.0093 | -4.29% | $11.08M | $124.94M | 13.48B Percentage96.74% Circulating supply13.48B Maximum Supply13.93B |
|
| ||
| $0.0806 $0.0806 | -4.29% | $5.48M | $13.83M | 171.62M Percentage34.32% Circulating supply171.62M Maximum Supply500M |
|
| ||
| $0.0...06157 $0.0001 | -4.29% | $15.48K | $1.83M | 29.71B Percentage32.21% Circulating supply29.71B Maximum Supply92.23B | ||||
| $0.0767 $0.0767 | -4.28% | $12.01M | $69.43M | 904.96M Percentage90.50% Circulating supply904.96M Maximum Supply1B | ||||
| $0.0...05484 $0.0001 | -4.28% | $9.3M | $299.79M | 5.47T | ||||
| $0.0075 $0.0075 | -4.28% | $537.35K | $1.02M | 134.79M | ||||
| $0.0...01359 $0.0000 | -4.28% | -- | $148.32K | 109.1T Self Reported Circulating Supply109.1T Self Reported Max Supply109.1T | ||||
| $0.0...01570 $0.0000 | -4.27% | $21 | $157.06K | 10B Self Reported Circulating Supply10B Self Reported Max Supply0 | ||||
| $0.0...02688 $0.0000 | -4.27% | -- | $113.1K | 420.69T Self Reported Circulating Supply420.69T Self Reported Max Supply420.69T | ||||
| $0.0...05391 $0.0000 | -4.27% | -- | $269.56K | 500T Self Reported Circulating Supply500T Self Reported Max Supply500T | ||||
| $0.0061 $0.0061 | -4.27% | $535 | $213.59K | 35.22M Percentage4.40% Circulating supply35.22M Maximum Supply800M | ||||
| $17.1989 $17.1989 | -4.26% | $230.47M | $7.26B | 422.03M Percentage58.96% Circulating supply422.03M Maximum Supply715.75M |
|
| ||
| $0.0134 $0.0134 | -4.26% | $8.57K | $281.13K | 21M Self Reported Circulating Supply21M Self Reported Max Supply21M | ||||
| $0.0300 $0.0300 | -4.26% | $64.11K | $21.08M | 703.73M Percentage23.36% Circulating supply703.73M Maximum Supply3.01B |
|
| ||
| $0.0121 $0.0121 | -4.26% | $58.73K | $1.21M | 100M Self Reported Circulating Supply100M Self Reported Max Supply100M | ||||
| $0.0...09204 $0.0000 | -4.25% | -- | $9.2K | 999.86M Self Reported Circulating Supply999.86M Self Reported Max Supply999.86M | ||||
| $0.0...01244 $0.0001 | -4.25% | -- | $124.47K | 1B Self Reported Circulating Supply1B Self Reported Max Supply1B | ||||
| $0.0...06918 $0.0000 | -4.25% | -- | $69.18K | 100T Self Reported Circulating Supply100T Self Reported Max Supply100T | ||||
| $0.6057 $0.6057 | -4.24% | $142.09M | $2.04B | 3.37B Percentage54.12% Circulating supply3.37B Maximum Supply6.22B |
|
| ||
| $0.5644 $0.5644 | -4.24% | $25.22M | $193.86M | 343.47M Percentage101.05% Circulating supply343.47M Maximum Supply339.89M |
|
| ||
| $0.0019 $0.0019 | -4.24% | -- | $30.83K | 16.08M Percentage73.08% Circulating supply16.08M Maximum Supply22M | ||||
| $0.9853 $0.9853 | -4.23% | $4.36K | $9.14M | 9.28M Self Reported Circulating Supply9.28M Self Reported Max Supply10M | ||||
| $0.0...06322 $0.0000 | -4.23% | -- | $537.45K | 850T Self Reported Circulating Supply850T Self Reported Max Supply850T | ||||
| $0.0044 $0.0044 | -4.23% | $58.13K | $150.14K | 33.86M Self Reported Circulating Supply33.86M Self Reported Max Supply89.88M | ||||
| $0.0...01434 $0.0000 | -4.22% | -- | $6.03K | 42069T Self Reported Circulating Supply42069T Self Reported Max Supply42069T | ||||
| $0.0...02748 $0.0000 | -4.22% | $11 | -- | 0 Percentage0.00% Circulating supply0 Maximum Supply2000T | ||||
| $0.0274 $0.0274 | -4.22% | $7.76M | $27.39M | 999.96M Percentage100.00% Circulating supply999.96M Maximum Supply1B | ||||
| $0.0...03682 $0.0000 | -4.22% | $316.23K | $483.56K | 13.13B Percentage13.13% Circulating supply13.13B Maximum Supply100B | ||||
| $0.0...04642 $0.0005 | -4.22% | -- | -- | 0 Percentage0.00% Circulating supply0 Maximum Supply1000M | ||||
| $0.0...01171 $0.0000 | -4.22% | -- | $11.71K | 1B Self Reported Circulating Supply1B Self Reported Max Supply1B | ||||
| $0.0010 $0.0010 | -4.21% | -- | -- | 0 | ||||
| $0.0529 $0.0529 | -4.21% | $3.69M | $52.78M | 997.21M |
|
| ||
| $0.5456 $0.5456 | -4.21% | $90.12K | $7.37M | 13.5M Percentage67.50% Circulating supply13.5M Maximum Supply20M |
|
| ||
| $0.5063 $0.5063 | -4.21% | $356.48K | $2.22M | 4.39M Percentage43.91% Circulating supply4.39M Maximum Supply10M | ||||
| $0.0...01096 $0.0000 | -4.20% | -- | $46.12K | 420.69B Self Reported Circulating Supply420.69B Self Reported Max Supply420.69B | ||||
| $0.0...06401 $0.0001 | -4.20% | $51.47K | $38.22K | 597.08M Self Reported Circulating Supply597.08M Self Reported Max Supply999.73M | ||||
| $0.9185 $0.9185 | -4.20% | $2.6M | $1.97M | 2.15M Self Reported Circulating Supply2.15M Self Reported Max Supply10M | ||||
| $0.0...07015 $0.0000 | -4.19% | -- | $4.68K | 666.67B Self Reported Circulating Supply666.67B Self Reported Max Supply666.67B | ||||
| $0.0...07081 $0.0000 | -4.19% | $5 | $70.82K | 10B Self Reported Circulating Supply10B Self Reported Max Supply10B | ||||
| $0.0671 $0.0671 | -4.19% | $22.26M | $93.9M | 1.4B Percentage28.00% Circulating supply1.4B Maximum Supply5B | ||||
| $3.5383 $3.5383 | -4.19% | -- | $855.97K | 241.92K Self Reported Circulating Supply241.92K Self Reported Max Supply500K | ||||
| $0.0014 $0.0014 | -4.18% | -- | $548.89K | 391.24M Percentage78.25% Circulating supply391.24M Maximum Supply500M |
Latest Crypto News
-

-

-

-

-

-

-

-

-

-

-

-

-

- Decoding the Buzz: BAT Community Call on June 27th - What You Need to Know
- Jun 26,2025 at 11:13pm
- Get the lowdown on the latest BAT Community Call held on June 27th. We'll dive into key discussions around search algorithms, information distribution, and what it means for the future of online advertising.
-

-


