 |
|
 |
|
 |
|
 |
|
 |
|
 |
|
 |
|
 |
|
 |
|
 |
|
 |
|
 |
|
 |
|
 |
|
 |
|
Hederaは、ここ数ヶ月で最も話題になっている暗号プロジェクトの1つです。多くの強気の予測がアナリストから注がれています

Hedera (HBAR) has been a hot topic in recent months, with many analysts making bullish predictions. However, despite all the hype, the reality on the charts may tell a different story.
Hedera(HBAR)はここ数ヶ月でホットなトピックであり、多くのアナリストが強気の予測を行っています。しかし、すべての誇大広告にもかかわらず、チャートの現実は別の話をするかもしれません。
The HBAR price is still lagging, and 2025 has not been kind to holders so far. Many analysts are acting more like crypto cheerleaders than real observers of the market. If we go by their predictions, Hedera should be breaking new highs by now, and HBAR coin value should be making swimmers out of traders. But the opposite is true. We are halfway into 2025, and HBAR is trading well below where it started the year.
HBARの価格はまだ遅れており、2025年はこれまでのところ保有者に親切ではありませんでした。多くのアナリストは、市場の本当のオブザーバーよりも暗号のチアリーダーのように行動しています。私たちが彼らの予測を行うならば、ヘデラは今までに新しい高値を破っているはずであり、HBARコインの価値はトレーダーからスイマーを追い出すはずです。しかし、反対は真実です。私たちは2025年の途中であり、HBARはその年を始めた場所をはるかに下回っています。
HBAR Price Has Underperformed in 2023
HBARプライスは2023年にパフォーマンスが低くなりました
On January 1, 2025, Hedera was trading around $0.28. Now it is sitting closer to $0.16, down by about 40%. This kind of move wasn’t predicted by most analysts who were calling for a big upside. Instead of asking how to manage excess profits, many holders are wondering when the bleeding will stop.
2025年1月1日、ヘデラは約0.28ドルを取引していました。現在、0.16ドルに近づいており、約40%減少しています。この種の動きは、大きな利点を求めていたほとんどのアナリストによって予測されていませんでした。過剰な利益を管理する方法を尋ねる代わりに、多くの保有者は、出血がいつ停止するのか疑問に思っています。
This poor performance raises serious questions about the likelihood of HBAR hitting $1 in 2025. For that to happen from the current $0.16 level, the HBAR price would need to rise by about 525%. At first glance, that seems achievable in the crypto space where tokens can jump by over 1,000% in just a few weeks. Onyxcoin (XCN) for example, surged more than 1,500% within two weeks earlier this year.
このパフォーマンスの低下は、2025年にHBARが1ドルに達する可能性に関する深刻な疑問を提起します。現在の0.16レベルから発生するため、HBAR価格は約525%上昇する必要があります。一見、それはわずか数週間でトークンが1,000%以上ジャンプできる暗号空間で達成可能であると思われます。たとえば、Onyxcoin(XCN)は、今年の2週間以内に1,500%以上急増しました。
However, HBAR’s current chart structure suggests a completely different direction. The price action is showing signs of weakness, and indicators suggest that more downside is possible before any potential reversal.
ただし、HBARの現在のチャート構造は、まったく異なる方向を示唆しています。価格アクションは衰弱の兆候を示しており、指標は潜在的な逆転の前に、より多くの欠点が可能であることを示唆しています。
Hedera’s Fundamentals: Still Solid, But Not Enough
Hederaの基礎:まだ堅実ですが、十分ではありません
Hedera uses the Hashgraph consensus mechanism to enable fast, secure transactions. The network supports smart contracts, low fees, and fair transaction ordering. It is also backed by major corporate partners who sit on its governing council. These partners include Google, IBM, Boeing, and several others.
Hederaは、ハッシュグラフコンセンサスメカニズムを使用して、高速で安全なトランザクションを可能にします。ネットワークは、スマートコントラクト、低料金、公正な取引注文をサポートしています。また、統治評議会に座っている主要な企業パートナーによって支援されています。これらのパートナーには、Google、IBM、Boeing、その他いくつかのパートナーが含まれます。
From a technology and partnership standpoint, Hedera is impressive. The platform is being developed for real-world enterprise use cases including DeFi, NFTs, and supply chain tracking. Ongoing upgrades focus on speed, security, and usability. It’s even aligned with the ISO 20022 standard, giving it a potential edge for regulatory compliance and institutional adoption.
テクノロジーとパートナーシップの観点から、ヘデラは印象的です。このプラットフォームは、DEFI、NFTS、サプライチェーン追跡など、実際のエンタープライズユースケース向けに開発されています。継続的なアップグレードは、速度、セキュリティ、ユーザビリティに焦点を当てています。 ISO 20022標準とさえ整合しており、規制のコンプライアンスと制度的採用の潜在的な優位性を与えています。
But despite these positives, they are not translating into upward momentum for the HBAR price. The broader crypto market trends, competition from other blockchain platforms, and hesitation from institutional players are still major hurdles.
しかし、これらのポジティブにもかかわらず、それらはHBAR価格の上向きの勢いに翻訳されていません。より広範な暗号市場の動向、他のブロックチェーンプラットフォームとの競争、および機関のプレーヤーからのためらうことは、依然として大きなハードルです。
HBAR Price Pattern Signals Bearish Momentum
HBARの価格パターンシグナルは、勢いが悪くなります
The current structure of the HBAR price is forming a descending triangle. This is a bearish pattern that often leads to a breakdown. The horizontal support level at around $0.12 has been tested several times. Each bounce has been weaker than the last, and the pattern of lower highs shows that buyer interest is fading.
HBAR価格の現在の構造は、下降三角形を形成しています。これは、しばしば故障につながる弱気なパターンです。約0.12ドルの水平サポートレベルが数回テストされています。各バウンスは最後のバウンスよりも弱く、より低い高値のパターンは、買い手の関心が衰退していることを示しています。
The triangle is closing in on its apex, and if the price breaks below the $0.12 level, the next likely support could be around $0.09 to $0.10. This suggests that there may still be more room to fall before any serious recovery attempt begins.
三角形はその頂点に閉じ込められており、価格が0.12ドルのレベルを下回った場合、次のサポートは0.09ドルから0.10ドルである可能性があります。これは、深刻な回復の試みが始まる前に、まだ落ちる余地がまだあるかもしれないことを示唆しています。
RSI and MACD Indicators Are Still Bearish
RSIおよびMACDインジケーターはまだ弱気です
The Relative Strength Index (RSI) is currently around 42.96. That is below the neutral level of 50 and suggests that bearish momentum is still dominating. The RSI has failed to break above 50 multiple times, and its most recent attempt stalled near 40. This type of move often happens before another leg downward. There’s also no bullish divergence on the RSI, which further confirms the weak momentum.
相対強度指数(RSI)は現在42.96前後です。それは50のニュートラルレベルを下回っており、弱気の勢いがまだ支配していることを示唆しています。 RSIは複数回50を超えることに失敗し、最近の試みは40近くに失速しました。また、RSIに強気の発散はありません。これは、弱い勢いをさらに確認します。
The MACD is showing the same weakness. The MACD line is only slightly above the signal line and does not show real strength. The histogram is shrinking and looks ready to turn red again. This indicates that the recent bounce is losing steam. There was a bearish crossover in early May, and the MACD has not shown convincing strength since then. The last significant bullish wave was back in late 2024, but it did not hold.
MACDは同じ弱点を示しています。 MACDラインは信号線のわずかに上にあるだけで、実際の強度は表示されません。ヒストグラムは縮小しており、再び赤くなるように見えます。これは、最近のバウンスが蒸気を失っていることを示しています。 5月上旬には弱気のクロスオーバーがあり、MACDはそれ以来説得力のある強さを示していません。最後の重要な強気波は2024年後半に戻ってきましたが、保持されませんでした。
These indicators all tell the same story: HBAR buyers are not stepping up in full force. Sellers are still in control, and small bounces are being sold rather than accumulated.
これらの指標はすべて同じストーリーを語っています。HBARバイヤーは完全に強制的にステップアップしていません。売り手はまだコントロールされており、蓄積されるのではなく、小さなバウンスが販売されています。
Will HBAR Hit $1 in 2025?
HBARは2025年に1ドルに達しますか?
While the Hedera network has strong fundamentals, the HBAR price is not reflecting that optimism. Technical indicators and price patterns suggest weakness, not strength. RSI is still low. MACD is bearish. Price is trending in a descending triangle with repeated failed attempts to break higher.
Hederaネットワークには強い基本がありますが、HBARの価格はその楽観主義を反映していません。技術的指標と価格パターンは、強さではなく衰弱を示唆しています。 RSIはまだ低いです。 MACDは弱気です。下降する三角形では価格が上昇しており、繰り返し失敗した試みが上昇しようとしています。
Read Also: Stellar Price Prediction: Will Lumens Hit $1 in 2025 Amid Bearish
また読む:恒星の価格予測:2025年にルーメンは弱気で1ドルに達しますか
免責事項:info@kdj.com
提供される情報は取引に関するアドバイスではありません。 kdj.com は、この記事で提供される情報に基づいて行われた投資に対して一切の責任を負いません。暗号通貨は変動性が高いため、十分な調査を行った上で慎重に投資することを強くお勧めします。
このウェブサイトで使用されているコンテンツが著作権を侵害していると思われる場合は、直ちに当社 (info@kdj.com) までご連絡ください。速やかに削除させていただきます。
-

-
![Dogecoin [doge]抵抗を過ぎてきれいなブレイクアウトの後に市場の注意を取り戻す Dogecoin [doge]抵抗を過ぎてきれいなブレイクアウトの後に市場の注意を取り戻す](/assets/pc/images/moren/280_160.png)
-

-
![Dogwifhat [wif]は、6月の初めにサポートとして以前の範囲を高めました。最新の再テストは、Memecoinに対して肯定的な価格反応をもたらしました。 Dogwifhat [wif]は、6月の初めにサポートとして以前の範囲を高めました。最新の再テストは、Memecoinに対して肯定的な価格反応をもたらしました。](/assets/pc/images/moren/280_160.png)
-

-

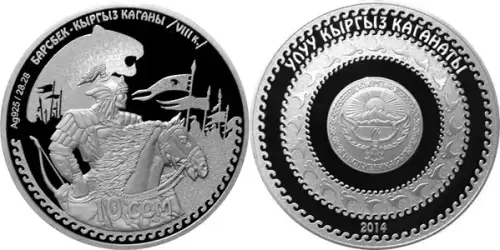
- Barsbekの価格 - Kyrgyz CoinのKaganは6倍に跳ね上がりました
- 2025-06-14 14:00:21
- これはその価値に影響を与え、6倍に跳ね上がりました。
-

-

-


![Dogecoin [doge]抵抗を過ぎてきれいなブレイクアウトの後に市場の注意を取り戻す Dogecoin [doge]抵抗を過ぎてきれいなブレイクアウトの後に市場の注意を取り戻す](/uploads/2025/06/11/cryptocurrencies-news/articles/dogecoin-doge-reclaims-market-attention-clean-breakout-resistance/684964f4a124a_image_500_300.webp)

![Dogwifhat [wif]は、6月の初めにサポートとして以前の範囲を高めました。最新の再テストは、Memecoinに対して肯定的な価格反応をもたらしました。 Dogwifhat [wif]は、6月の初めにサポートとして以前の範囲を高めました。最新の再テストは、Memecoinに対して肯定的な価格反応をもたらしました。](/uploads/2025/06/11/cryptocurrencies-news/articles/dogwifhat-wif-retested-range-support-earlier-june-retest-yielded-positive-price-reaction-memecoin/6849648fbd663_image_500_300.webp)


