






















 |
|
 |
|
 |
|
 |
|
 |
|
 |
|
 |
|
 |
|
 |
|
 |
|
 |
|
 |
|
 |
|
 |
|
 |
|
Bitcoin rebounds after starting April on a downturn. Let’s analyze the future prospects for the BTC price together.
ビットコインは4月に下落から始まった後、反発した。 BTC価格の今後の見通しを一緒に分析してみましょう。

Bitcoin (BTC) Situation
While Bitcoin faced selling pressure in the early days of April, the leading cryptocurrency’s price has recovered after hitting a new low at $64,500. Indeed, it reached $72,000 this Monday. This price level seems to have acted as resistance, with BTC struggling to surpass it. In fact, this Tuesday morning, the Bitcoin price fell back below the previous resistance level identified at $71,270. At the time of writing, Bitcoin is trading around $70,000.
ビットコイン(BTC)の状況ビットコインは4月初めに売り圧力に直面したが、主要仮想通貨の価格は64,500ドルの新安値を付けた後回復した。実際、今週月曜日には72,000ドルに達しました。この価格水準は抵抗線として機能しているようで、BTCはそれを超えるのに苦労している。実際、今週火曜日の朝、ビットコイン価格は以前の抵抗線である71,270ドルを下回りました。この記事の執筆時点では、ビットコインは約7万ドルで取引されています。
Bitcoin is holding slightly above the value zone located around $69,800, which could serve as support. Overall, Bitcoin’s trend remains bullish, as evidenced by the 50 and 200-day moving averages. Regarding market dynamics, a slight rebound is observed, though it is not yet significant, as indicated by the oscillators. This phenomenon could prove harmful in the long term.
ビットコインは69,800ドル付近にあるバリューゾーンをわずかに上回って推移しており、これがサポートとなる可能性がある。 50 日移動平均と 200 日移動平均で証明されているように、全体的にビットコインの傾向は引き続き強気です。市場のダイナミクスに関しては、オシレーターが示すように、まだ顕著ではありませんが、わずかな反発が観察されています。この現象は長期的には有害であることが判明する可能性があります。
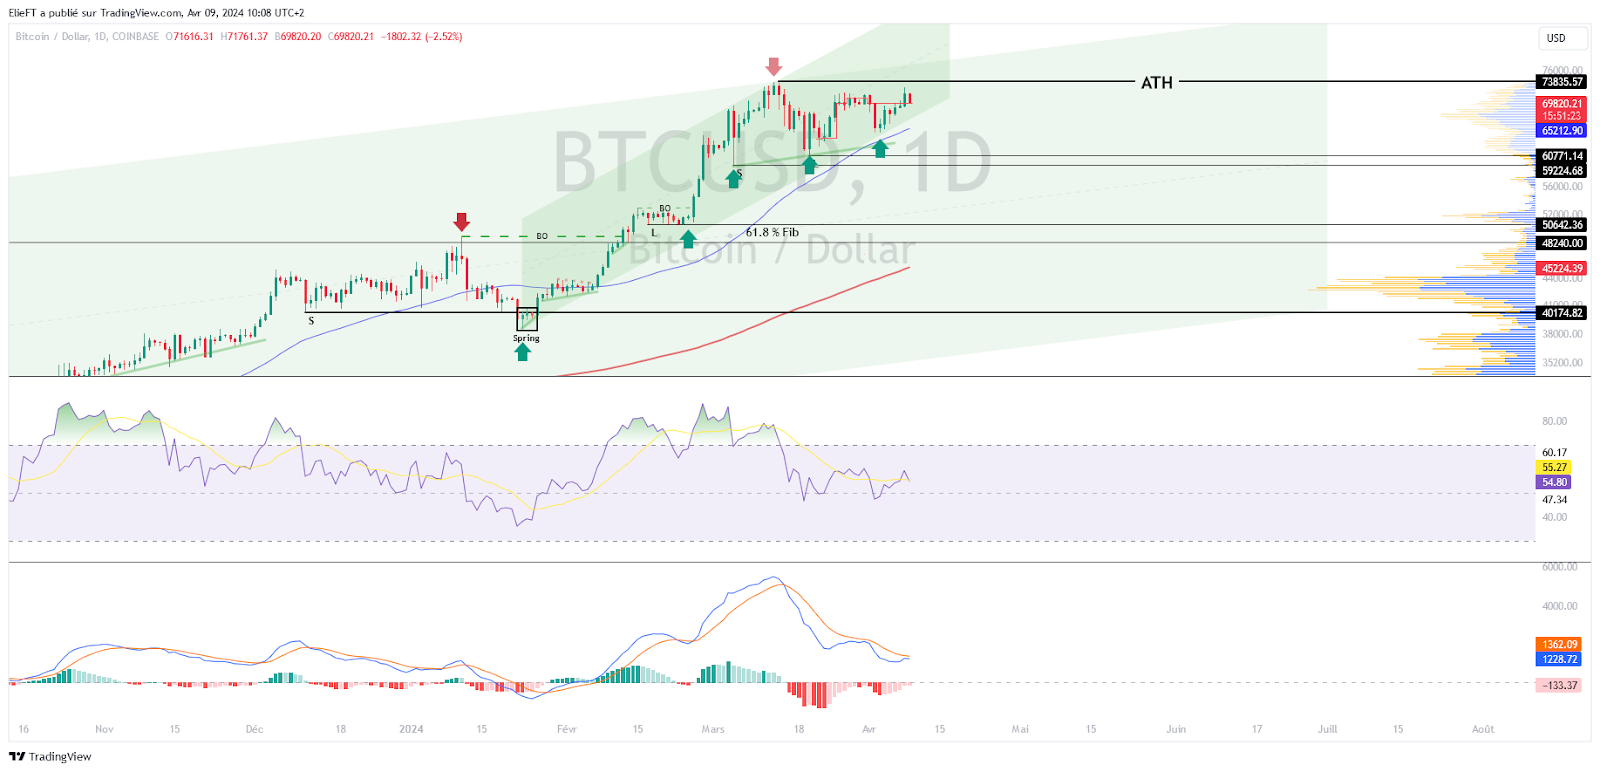
The current technical analysis has been conducted in collaboration with Elie FT, an investor and passionate trader in the cryptocurrency market. Now a trainer with Family Trading, a community of thousands of proprietary traders active since 2017. You will find live sessions, educational content, and peer support around financial markets in a professional and warm atmosphere.
日次 BTCUSD チャート現在のテクニカル分析は、暗号通貨市場の投資家であり熱心なトレーダーである Elie FT と協力して実施されました。現在は、2017 年から活動している数千人の自己トレーダーのコミュニティである Family Trading のトレーナーです。プロフェッショナルで温かい雰囲気の中で、金融市場に関するライブ セッション、教育コンテンツ、ピア サポートを見つけることができます。
Focus on Derivatives (BTCUSDT)
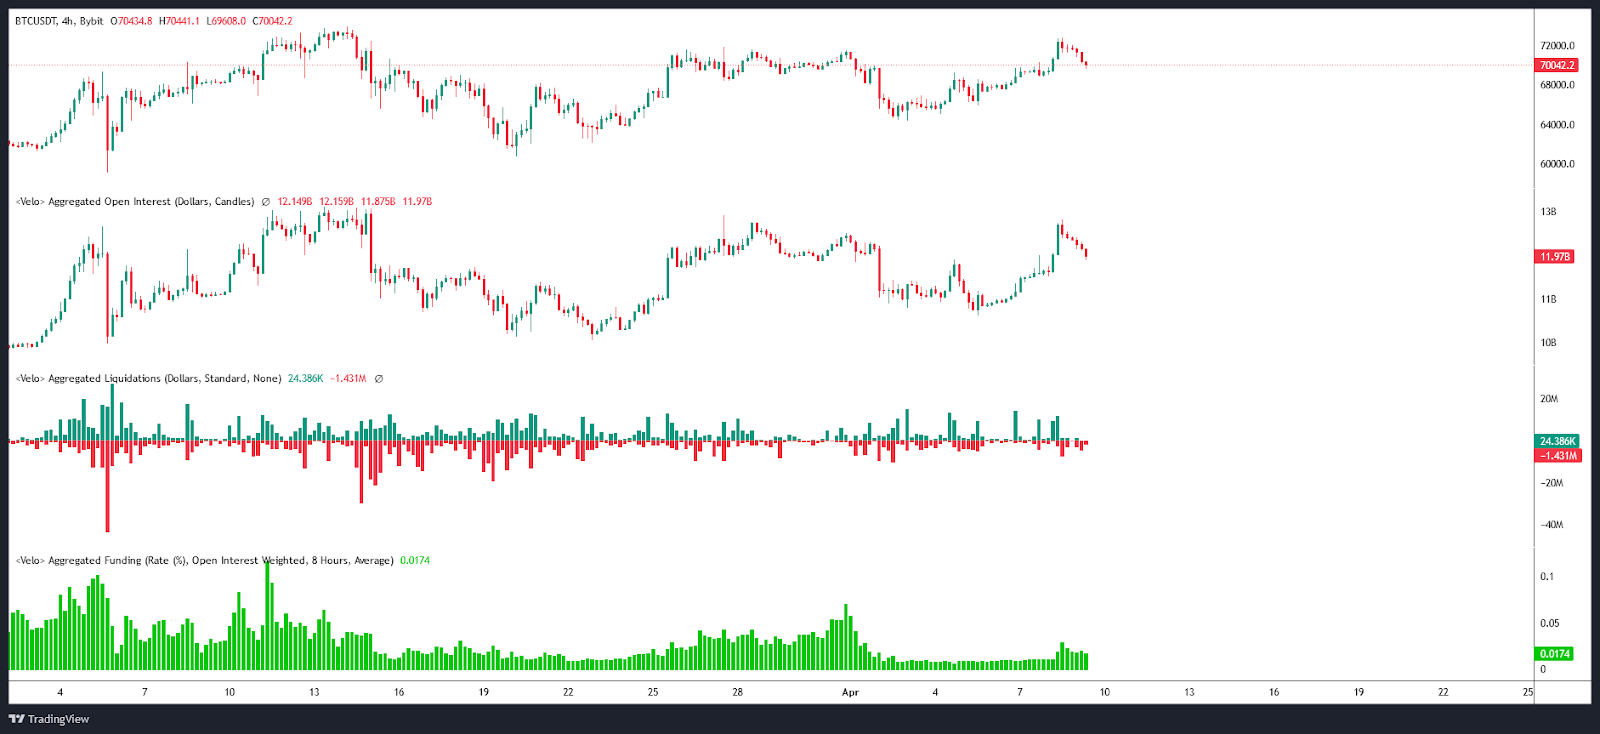
The open interest in BTC/USDT contracts has followed the direction of its price. Indeed, we can see that they increased before slightly decreasing this Tuesday, April 9th in the morning. It is interesting to note that the majority of the liquidations have recently been of short positions. Coupled with a subtle increase in the funding rate, this indicates that the interest in Bitcoin perpetual contracts has recently been predominantly on the buy side.
デリバティブ (BTCUSDT) に注目BTC/USDT 契約の建玉は価格の方向に従いました。確かに、今週火曜日、4月9日午前中にわずかに減少する前に増加したことがわかります。興味深いのは、最近の清算の大部分がショートポジションによるものであるということです。資金調達率の微妙な上昇と相まって、これはビットコイン永久契約への関心が最近主に買い側にあることを示しています。
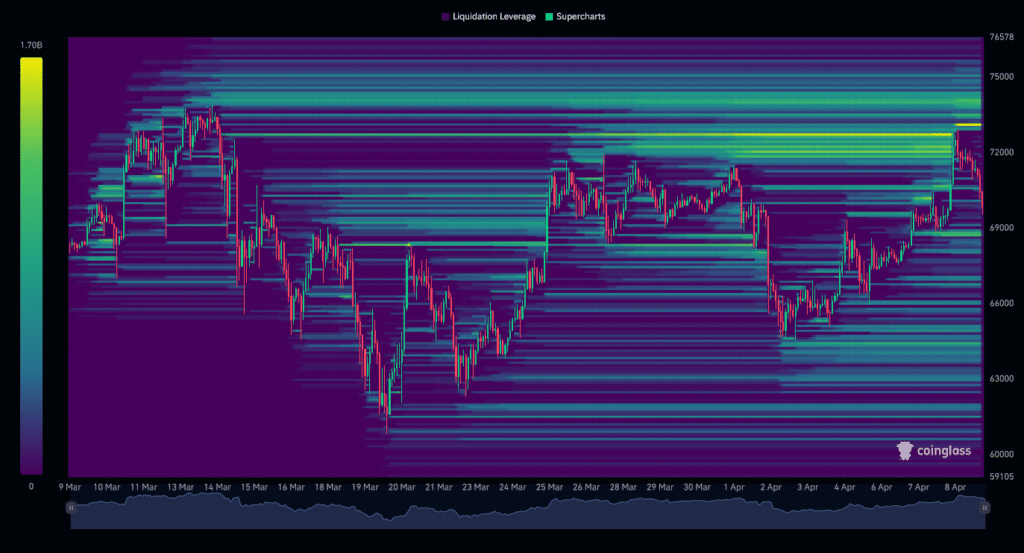
The liquidation heat map of the past month indicates that BTC/USDT has gone through a significant liquidation area, located around $72,000. Currently, the Bitcoin price seems to show selling interest at this level, marking a slight distribution phase. At present, the most significant liquidation zone above the current price is in a price range between $73,000 and $75,000. Below the current price, the notable levels are $69,000 and further down, $64,500. If the market approaches these levels, we could witness a massive triggering of orders, potentially increasing the cryptocurrency’s volatility. These zones, therefore, represent a major point of interest for investors.
ビットコインの建玉 / 清算と資金調達レート先月の清算ヒート マップは、BTC/USDT が約 72,000 ドルの重要な清算領域を通過したことを示しています。現在、ビットコイン価格はこのレベルで売り意欲を示しているようで、わずかな流通局面を示しています。現在、現在価格を上回る最も重要な清算ゾーンは、73,000 ドルから 75,000 ドルの間の価格範囲にあります。現在の価格を下回ると、注目すべき水準は 69,000 ドル、さらに下では 64,500 ドルです。市場がこれらのレベルに近づくと、大量の注文が発生し、仮想通貨のボラティリティが高まる可能性があります。したがって、これらのゾーンは投資家にとって大きな関心事となります。
Hypotheses for the Bitcoin (BTC) Price
- If the Bitcoin price manages to hold above $69,000, we could anticipate a bullish continuation up to the $73,000 level. The next resistance to consider, if the bullish movement continues, would be $74,000 or even $75,000 and beyond. At this point, it would represent an increase of over 7%.
- If the Bitcoin price fails to hold above $69,000, we might expect buyer support around $67,000. The next level to consider, if the bearish movement continues, would be in a price range around $64,000 and $63,000. At that stage, it would represent a drop of nearly -9%.
Conclusion
In the face of early April’s turbulence, Bitcoin shows a bullish trend supported by signs of resilience above key support levels. Despite the immediate challenges, it seems likely that buyers predominate the market. Nevertheless, it will be crucial to closely observe the price reaction at different key levels to confirm or invalidate the current hypotheses. It is also important to remain vigilant of potential “fake outs” and market “squeezes” in each scenario. Finally, let’s remember that these analyses are based solely on technical criteria and that cryptocurrency prices can evolve rapidly due to other more fundamental factors.
BTC 清算ヒートマップ (1 か月) ビットコイン (BTC) 価格の仮説ビットコイン価格がなんとか 69,000 ドルを超えて維持できれば、73,000 ドルレベルまで強気の継続が予想される可能性があります。強気の動きが続く場合、次に考慮すべき抵抗線は、74,000ドル、あるいは75,000ドル、あるいはそれ以上になるでしょう。この時点で、これは7%以上の上昇を意味します。ビットコイン価格が69,000ドルを超えて維持できなかった場合、買い手のサポートは67,000ドル付近になると予想される可能性があります。弱気の動きが続く場合、次に検討すべきレベルは64,000ドルから63,000ドル付近の価格帯となるだろう。その段階では、-9%近くの下落に相当します。 結論 4月初旬の混乱に直面して、ビットコインは主要なサポートレベルを上回る回復力の兆候に支えられ、強気傾向を示しています。差し迫った課題にもかかわらず、市場では買い手が優勢である可能性が高いと思われる。それにもかかわらず、現在の仮説を確認または無効にするために、さまざまな主要レベルでの価格反応を注意深く観察することが重要です。各シナリオにおいて、潜在的な「フェイクアウト」や市場の「スクイーズ」に常に警戒し続けることも重要です。最後に、これらの分析は技術的な基準のみに基づいており、仮想通貨の価格は他のより基本的な要因によって急速に変動する可能性があることを覚えておいてください。
Maximize your Cointribune experience with our 'Read to Earn' program! Earn points for each article you read and gain access to exclusive rewards. Sign up now and start accruing benefits.
「Read to Earn」プログラムで Cointribune のエクスペリエンスを最大限に高めましょう!記事を読むたびにポイントを獲得し、限定特典にアクセスできます。今すぐサインアップして特典を獲得しましょう。

Family Trading est une Communauté de traders a compte propre active depuis 2017 offrant Lives, contenus éducatifs et entraides autour des marchés financiers dont celui des cryptomonnaies avec à ses côtés Elie FT, investisseur et trader de passion sur le marché crypto.
ここをクリックして「Read to Earn」に参加し、暗号通貨への情熱を報酬に変えましょう!AALink をコピーしましたファミリー トレーディングファミリー トレーディングは、2017 年から活動している個人口座トレーダーのコミュニティで、暗号通貨市場を含む金融市場を中心にライブ、教育コンテンツ、相互扶助を提供しています。暗号通貨市場の情熱的な投資家兼トレーダーであるエリーFTと並んで。
免責事項:info@kdj.com
提供される情報は取引に関するアドバイスではありません。 kdj.com は、この記事で提供される情報に基づいて行われた投資に対して一切の責任を負いません。暗号通貨は変動性が高いため、十分な調査を行った上で慎重に投資することを強くお勧めします。
このウェブサイトで使用されているコンテンツが著作権を侵害していると思われる場合は、直ちに当社 (info@kdj.com) までご連絡ください。速やかに削除させていただきます。





